Bitcoin price is again moving lower below the $26,500 support. BTC remains at risk of more losses below the $26,000 support in the near term.
Bitcoin started a fresh decline after it failed to clear the $27,500 resistance.
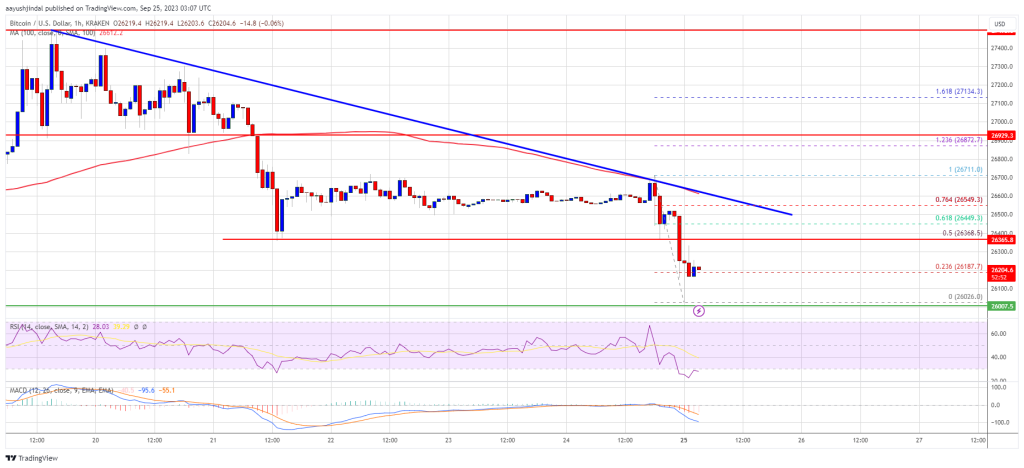
The price is trading below $26,500 and the 100 hourly Simple moving average.
There is a major bearish trend line forming with resistance near $26,500 on the hourly chart of the BTC/USD pair (data feed from Kraken).
The pair is now at risk of more downsides below the $26,000 level.
Bitcoin price failed to clear the $27,500 resistance and started a fresh decline. BTC traded below the $27,000 and $26,500 support levels to enter a bearish zone.
There was also a move below the $26,200 support level. The price tested the $26,000 zone. A low was formed near $26,026 and the price is now consolidating losses. It is trading just above the 23.6% Fib retracement level of the recent decline from the $26,711 swing high to the $26,026 low.
Bitcoin is now trading below $26,500 and the 100 hourly Simple moving average. Immediate resistance on the upside is near the $26,350 level. The first major resistance is near the $26,500 zone, a connecting bearish trend line, and the 61.8% Fib retracement level of the recent decline from the $26,711 swing high to the $26,026 low.
Source: BTCUSD on TradingView.com
The next key resistance could be near the $26,700 level, above which the price could gain bullish momentum. In the stated case, the price could even rise toward the $27,000 resistance. Any more gains might call for a move toward the $27,500 level.
If Bitcoin fails to start a fresh increase above the $26,500 resistance, it could continue to move down. Immediate support on the downside is near the $26,050 level.
The next major support is near the $26,000 level. A downside break and close below the $26,000 level might send the price further lower toward the next support at $25,400 in the coming sessions. Any more losses might call for a test of $25,000.
Technical indicators:
Hourly MACD – The MACD is now losing pace in the bearish zone.
Hourly RSI (Relative Strength Index) – The RSI for BTC/USD is now below the 50 level.
Major Support Levels – $26,000, followed by $25,400.
Major Resistance Levels – $26,350, $26,500, and $26,700.
[#item_full_content]NewsBTCRead MoreBitcoin Magazine Labor Department Proposal Could Open 401(k)s to Bitcoin and Alternative Assets The U.S.…
Analyst Willy Woo has highlighted how some old-school Bitcoin on-chain models could suggest a bottoming…
Bitcoin Magazine U.S. Senators Unveil ‘Mined in America Act’ to Reshore BTC Mining, Codify Bitcoin…
The XRP price traded at around $1.30 on Monday as markets consolidated and Bitcoin (BTC)…
The new rollout converts BTC to dollars by default for small businesses, aiming to embed…
The Bitcoin price could be on the verge of a major surge as new discussions…