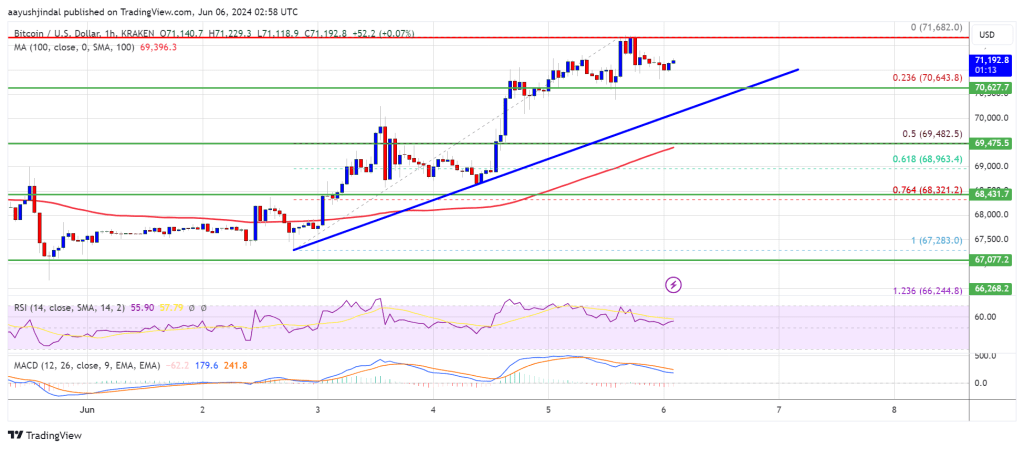
Bitcoin price started a decent increase above the $70,500 resistance. BTC is showing positive signs and might gain bullish momentum above the $72,000 resistance in the near term.
Bitcoin extended its increase above the $70,000 and $70,500 resistance levels.
The price is trading above $70,000 and the 100 hourly Simple moving average.
There is a key bullish trend line forming with support at $70,600 on the hourly chart of the BTC/USD pair (data feed from Kraken).
The pair could gain bullish momentum if it settles above the $72,000 level.
Bitcoin price remained stable above the $69,500 zone its extended its increase. BTC was able to clear the $70,000 and $70,200 levels to move further into a positive zone.
The bulls even pushed the price above $70,500. A high was formed at $71,682 and the price is now consolidating gains. The price is holding gains above the 23.6% Fib retracement level of the upward move from the $67,285 swing low to the $71,682 high.
Bitcoin is now trading above $70,500 and the 100 hourly Simple moving average. There is also a key bullish trend line forming with support at $70,600 on the hourly chart of the BTC/USD pair.
On the upside, the price is facing resistance near the $71,400 level. The first major resistance could be $71,650. The next key resistance could be $72,000. A clear move above the $72,000 resistance might send the price higher. In the stated case, the price could rise and test the $73,200 resistance. Any more gains might send BTC toward the $75,000 resistance.
If Bitcoin fails to climb above the $71,400 resistance zone, it could start another decline. Immediate support on the downside is near the $70,600 level and the trend line.
The first major support is $70,000. The next support is now forming near $69,500 or the 50% Fib retracement level of the upward move from the $67,285 swing low to the $71,682 high. Any more losses might send the price toward the $68,500 support zone in the near term.
Technical indicators:
Hourly MACD – The MACD is now losing pace in the bullish zone.
Hourly RSI (Relative Strength Index) – The RSI for BTC/USD is now above the 50 level.
Major Support Levels – $70,600, followed by $70,000.
Major Resistance Levels – $71,600, and $72,000.
[#item_full_content]NewsBTCRead MoreResearch shows that only 8% to 10% of global Bitcoin hashrate runs in oil-sensitive power…
Today’s quantum computers are far from breaking Bitcoin’s cryptography and any real threat would likely…
U.S. President Trump said stopping Iran is more of a concern than oil prices, as…
Crypto analyst Leshka has explained why it is unlikely that the Bitcoin price has bottomed…
Glassnode’s Accumulation Trend Score drops to 0.04 as smaller wallet cohorts offload BTC while macro…
Bitcoin Magazine Metaplanet Expands Bitcoin Strategy With Venture Fund and Asset Management Unit Tokyo-listed bitcoin…