Bitcoin price remained well supported above the $22,300 zone. BTC is rising and might aim a fresh increase above the $23,500 resistance zone.
Bitcoin started a minor downside correction and tested the $22,400 support zone.
The price is trading above $22,500 and the 100 hourly simple moving average.
There is a key bullish trend line forming with support near $22,100 on the hourly chart of the BTC/USD pair (data feed from Kraken).
The pair could start a fresh surge if it clears the $23,500 resistance zone.
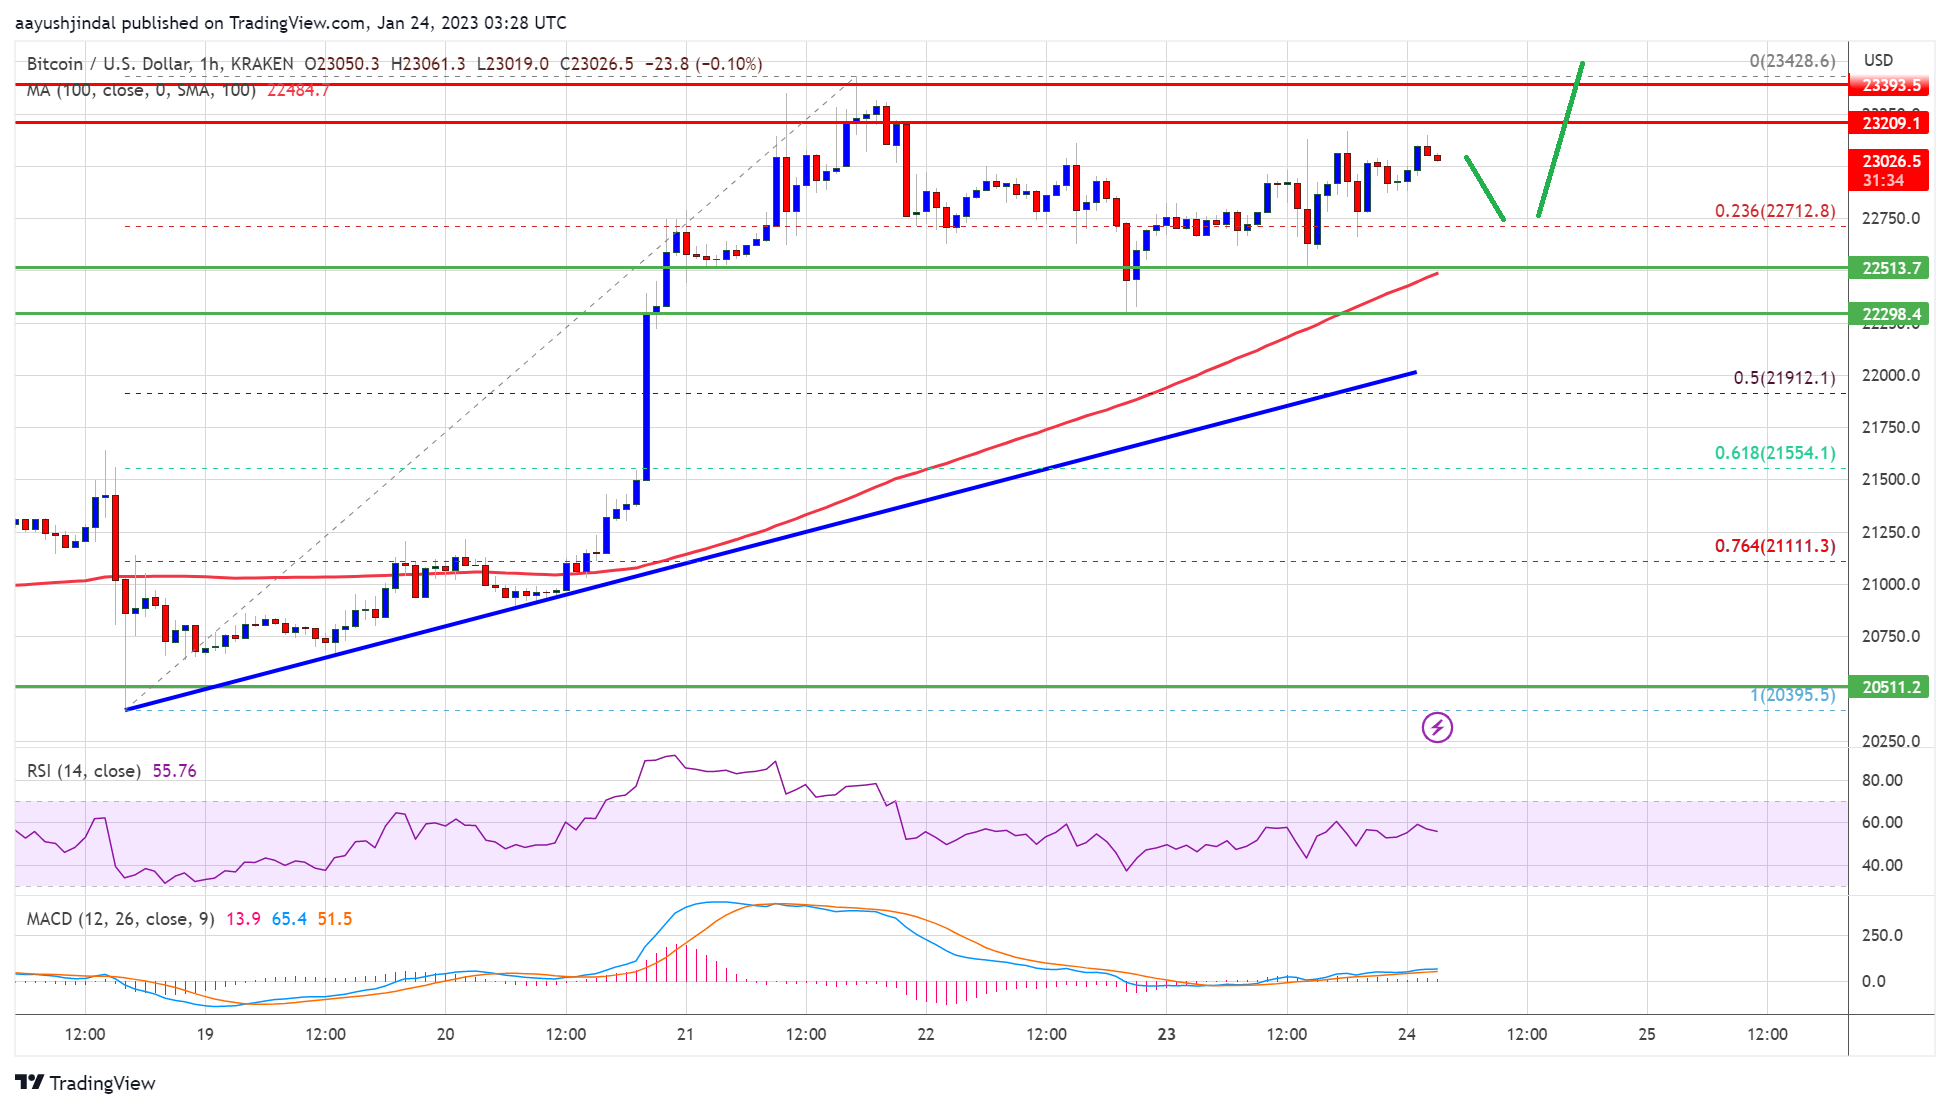
Bitcoin price gained pace above the $22,500 resistance zone. BTC even traded above the $23,000 level before it faced sellers near the $23,500 zone. There was a minor downside correction from the $23,400 zone, similar to ethereum.
The price traded as high as $23,428 before there was a downside correction. There was a move below the $23,000 level. The price even dipped below the 23.6% Fib retracement level of the upward wave from the $20,396 swing low to $24,249 high.
However, the price is stable above $22,500 and the 100 hourly simple moving average. There is also a key bullish trend line forming with support near $22,100 on the hourly chart of the BTC/USD pair.
Source: BTCUSD on TradingView.com
An immediate resistance is near the $23,200 level. The next major resistance is near the $23,400 zone, above which the price might gain bullish momentum. In the stated case, the price may perhaps rise even clear the $23,500 level. The next hurdle could be near the $24,200 level. Any more gains might send btc price towards the $25,000 level.
If bitcoin price fails to clear the $23,400 resistance, it could start another downside correction. An immediate support on the downside is near the $22,700 zone.
The next major support is near the $22,100 zone and the trend line, below which it could test the 50% Fib retracement level of the upward wave from the $20,396 swing low to $24,249 high. Any more losses might send the price to $21,500 in the near term.
Technical indicators:
Hourly MACD – The MACD is now gaining pace in the bullish zone.
Hourly RSI (Relative Strength Index) – The RSI for BTC/USD is now above the 50 level.
Major Support Levels – $22,700, followed by $22,100.
Major Resistance Levels – $23,200, $23,400 and $23,500.
Bitcoin price remained well supported above the $22,300 zone. BTC is rising and might aim a fresh increase above the $23,500 resistance zone.
Bitcoin started a minor downside correction and tested the $22,400 support zone.
The price is trading above $22,500 and the 100 hourly simple moving average.
There is a key bullish trend line forming with support near $22,100 on the hourly chart of the BTC/USD pair (data feed from Kraken).
The pair could start a fresh surge if it clears the $23,500 resistance zone.
Bitcoin price gained pace above the $22,500 resistance zone. BTC even traded above the $23,000 level before it faced sellers near the $23,500 zone. There was a minor downside correction from the $23,400 zone, similar to ethereum.
The price traded as high as $23,428 before there was a downside correction. There was a move below the $23,000 level. The price even dipped below the 23.6% Fib retracement level of the upward wave from the $20,396 swing low to $24,249 high.
However, the price is stable above $22,500 and the 100 hourly simple moving average. There is also a key bullish trend line forming with support near $22,100 on the hourly chart of the BTC/USD pair.
Source: BTCUSD on TradingView.com
An immediate resistance is near the $23,200 level. The next major resistance is near the $23,400 zone, above which the price might gain bullish momentum. In the stated case, the price may perhaps rise even clear the $23,500 level. The next hurdle could be near the $24,200 level. Any more gains might send btc price towards the $25,000 level.
If bitcoin price fails to clear the $23,400 resistance, it could start another downside correction. An immediate support on the downside is near the $22,700 zone.
The next major support is near the $22,100 zone and the trend line, below which it could test the 50% Fib retracement level of the upward wave from the $20,396 swing low to $24,249 high. Any more losses might send the price to $21,500 in the near term.
Technical indicators:
Hourly MACD – The MACD is now gaining pace in the bullish zone.
Hourly RSI (Relative Strength Index) – The RSI for BTC/USD is now above the 50 level.
Major Support Levels – $22,700, followed by $22,100.
Major Resistance Levels – $23,200, $23,400 and $23,500.
Tags: bitcoinbitcoin pricebtcusdBTCUSDTxbtusd
NewsBTCRead More
The Bitcoin market commenced an extended bearish phase in October 2025, after an initial flash…
BTC fell 2.2% as $299 million in liquidations hit crypto markets, with long positions accounting…
The average production cost was sitting at $88,000 per bitcoin in mid-March, according to Checkonchain's…
Traders are watching support near $1.40 as repeated failures below $1.60 reinforce broader downtrend.Read MoreCoinDesk:…
Bitcoin quietly gained ground while gold crumbled. That contrast has become one of the more…
Despite stabilizing spot prices, investors remain defensive, with leveraged speculation cooling and realized volatility dropping…