Bitcoin price started a recovery wave above the $55,000 resistance. BTC must clear the 100 hourly SMA to continue higher in the near term.
Bitcoin started a recovery wave above the $53,500 and $55,500 levels.
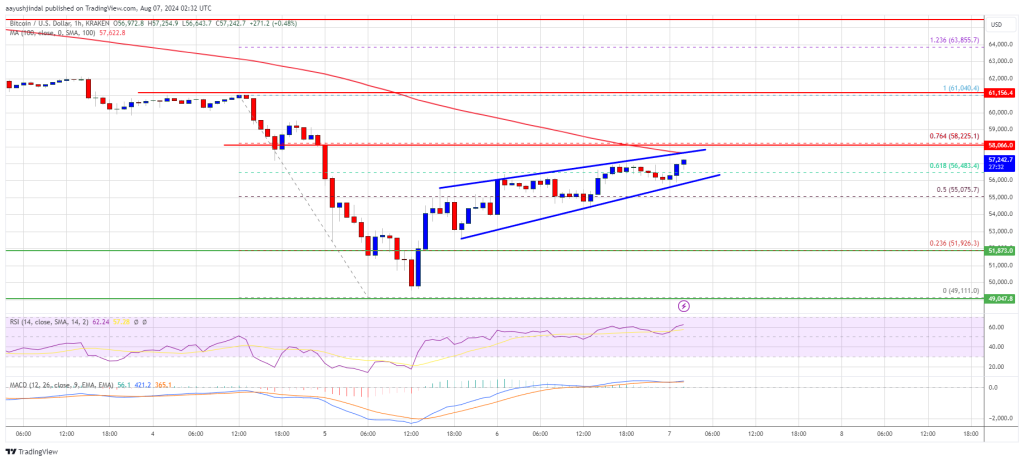
The price is trading below $58,000 and the 100 hourly Simple moving average.
There is a contracting triangle forming with resistance at $57,500 on the hourly chart of the BTC/USD pair (data feed from Kraken).
The pair might struggle to clear the $58,000 resistance zone.
Bitcoin price formed a base and started a recovery wave above the $52,500 resistance zone. BTC was able to clear the $53,500 and $55,500 resistance levels.
There was a move above the 61.8% Fib retracement level of the downward wave from the $61,040 swing high to the $49,110 swing low. The bulls even managed to push the price above the $56,500 resistance zone. However, the bears might remain active near $58,000.
Bitcoin price is still trading below $58,000 and the 100 hourly Simple moving average. On the upside, the price could face resistance near the $57,500 level. There is also a contracting triangle forming with resistance at $57,500 on the hourly chart of the BTC/USD pair.
The first key resistance is near the $58,250 level or the 76.4% Fib retracement level of the downward wave from the $61,040 swing high to the $49,110 swing low.
A clear move above the $58,250 resistance might send the price further higher in the coming sessions. The next key resistance could be $59,200. The next major hurdle sits at $60,000. A close above the $60,000 resistance might spark bullish moves. In the stated case, the price could rise and test the $62,000 resistance.
If Bitcoin fails to recover above the $58,250 resistance zone, it could start another decline. Immediate support on the downside is near the $56,000 level.
The first major support is $55,000. The next support is now near $53,500. Any more losses might send the price toward the $52,000 support zone in the near term.
Technical indicators:
Hourly MACD – The MACD is now gaining pace in the bullish zone.
Hourly RSI (Relative Strength Index) – The RSI for BTC/USD is now above the 50 level.
Major Support Levels – $56,000, followed by $55,000.
Major Resistance Levels – $57,500, and $58,250.
[#item_full_content]NewsBTCRead MoreMiners are facing significant challenges, with bitcoin revenue per petahash falling by half from a…
The invisible hands of market makers likely accelerated bitcoin's recent crash.Read MoreCoinDesk: Bitcoin, Ethereum, Crypto…
Bitcoin’s slide to $60,000 on Feb. 6 triggered a sharp surge of exchange inflows that…
What to Know: World Liberty Financial (WLFI) has rebounded 12%, signaling a renewed appetite for…
What to Know: Binance’s $300M SAFU purchase signals a shift toward hard assets, creating a…
What to Know: Block Inc. is cutting 10% of its staff to cap headcount at…