Bitcoin price is attempting a recovery wave above $111,500. BTC is now rising and might gain pace if it clears the $112,000 resistance level.
Bitcoin started a recovery wave above the $111,000 zone.
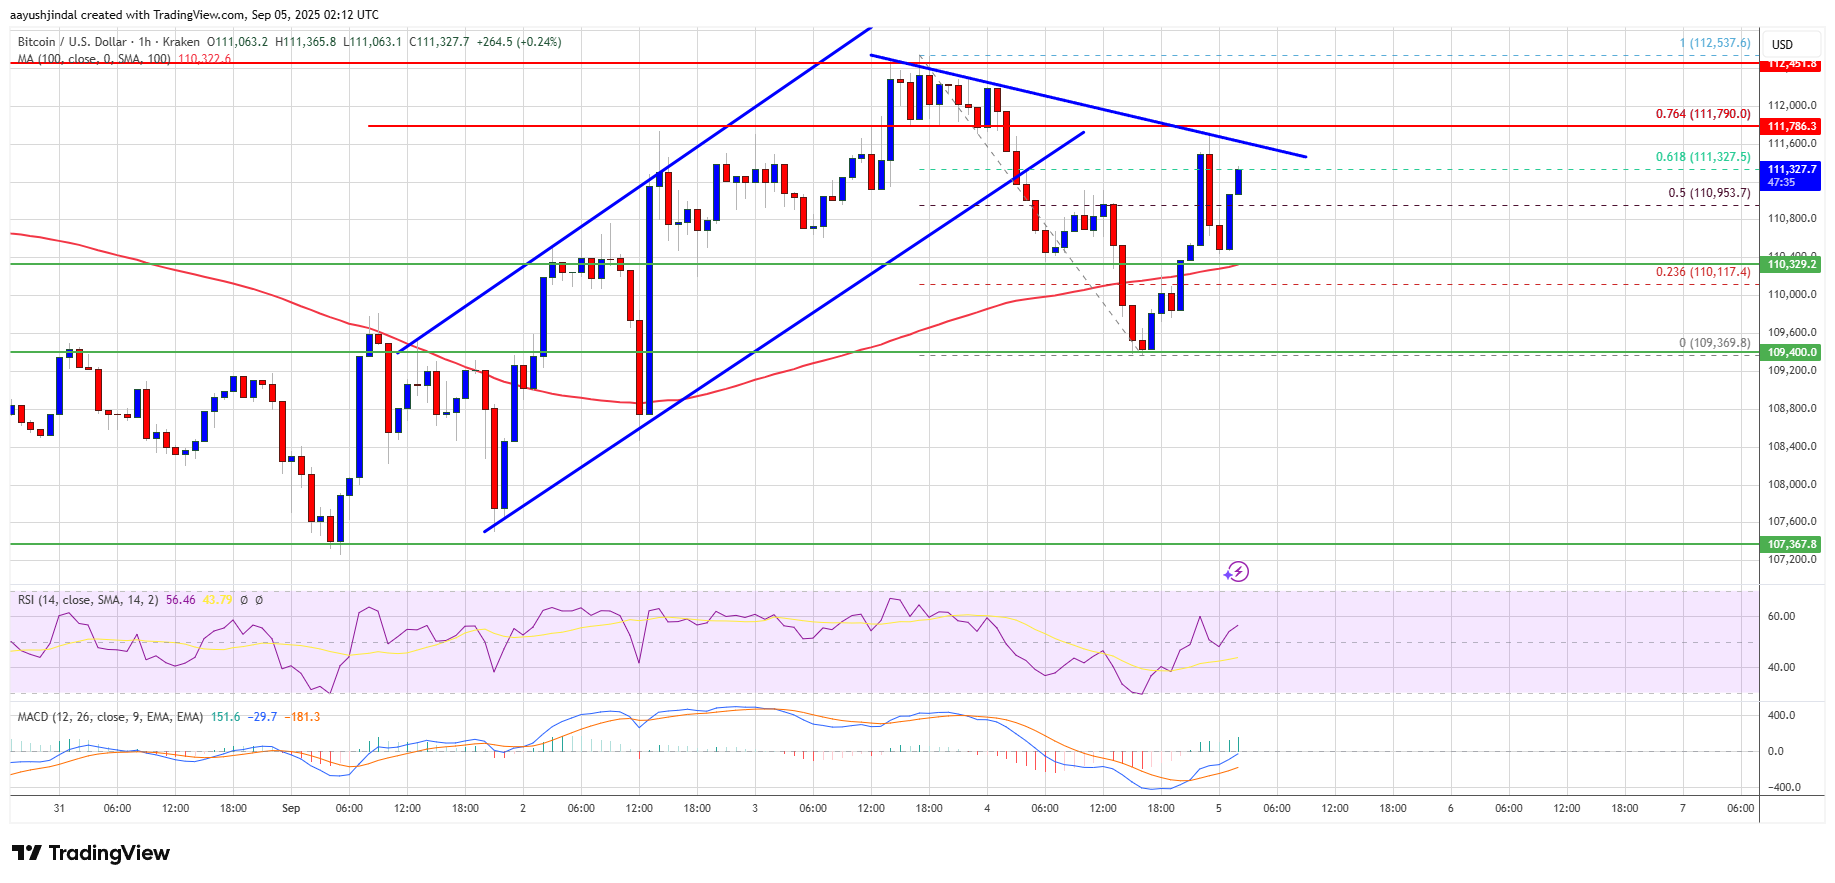
The price is trading above $111,000 and the 100 hourly Simple moving average.
There is a connecting bearish trend line forming with resistance at $111,600 on the hourly chart of the BTC/USD pair (data feed from Kraken).
The pair might start another decline if it stays below the $112,500 zone.
Bitcoin price started a fresh recovery wave above the $109,650 zone. BTC was able to climb above the $110,200 and $110,500 resistance levels.
The recent swing low was formed at $109,369 before the price climbed again. There was a move above the 50% Fib retracement level of the recent decline from the $112,537 swing high to the $109,369 low. However, the bears are active below the $112,000 level.
Bitcoin is now trading above $111,000 and the 100 hourly Simple moving average. Immediate resistance on the upside is near the $111,600 level. Besides, there is a connecting bearish trend line forming with resistance at $111,600 on the hourly chart of the BTC/USD pair.
The first key resistance is near the $111,800 level or the 76.4% Fib retracement level of the recent decline from the $112,537 swing high to the $109,369 low. The next resistance could be $112,000. A close above the $112,000 resistance might send the price further higher. In the stated case, the price could rise and test the $112,500 resistance level. Any more gains might send the price toward the $113,200 level. The main target could be $115,000.
If Bitcoin fails to rise above the $112,000 resistance zone, it could start a fresh decline. Immediate support is near the $111,000 level. The first major support is near the $110,350 level.
The next support is now near the $109,350 zone. Any more losses might send the price toward the $108,500 support in the near term. The main support sits at $107,500, below which BTC might decline sharply.
Technical indicators:
Hourly MACD – The MACD is now gaining pace in the bullish zone.
Hourly RSI (Relative Strength Index) – The RSI for BTC/USD is now above the 50 level.
Major Support Levels – $110,350, followed by $109,350.
Major Resistance Levels – $112,000 and $112,500.
[#item_full_content]NewsBTCRead MoreOn-chain data shows the key Bitcoin investors have been distributing recently, with their supply share…
Crypto prices edged higher on Friday despite a splash of tariff turbulence after the U.S.…
The industry’s largest cryptocurrencies, Bitcoin (BTC) and Ethereum (ETH), are enduring one of their most…
Bitcoin Magazine Nakamoto Inc. ($NAKA) Completes Acquisition of BTC Inc. and UTXO Management Nakamoto Inc.…
Bitcoin is struggling to reclaim the $69,000 level as persistent selling pressure continues to dominate…
Bitcoin Magazine Bitcoin Pops After Supreme Court Strikes Down Trump’s Tariffs The Supreme Court of…