Bitcoin price is consolidating near the $19,000 level against the US Dollar. BTC seems to be forming a short-term bullish pattern and might rise towards $20,000.
Bitcoin is struggling to gain pace for a move above the $19,200 level.
The price is trading below above $19,400 and the 100 hourly simple moving average.
There is a new connecting bearish trend line forming with resistance near $19,200 on the hourly chart of the BTC/USD pair (data feed from Kraken).
The pair could start a fresh increase unless there is a clear move below the $18,950 level.
Bitcoin Price Remains In A Range
Bitcoin price was seen trading in a range below the $20,000 resistance zone. BTC even settled below the $19,500 level and the 100 hourly simple moving average.
The last swing low was formed near $18,860 before there was a minor upside correction. The price was able to clear the 23.6% Fib retracement level of the downward move from the $19,560 swing high to $18,860 low. The bulls even pushed the price above the $19,200 level.
However, the bears were active above the $19,200 level. Bitcoin price struggled to clear the 50% Fib retracement level of the downward move from the $19,560 swing high to $18,860 low.
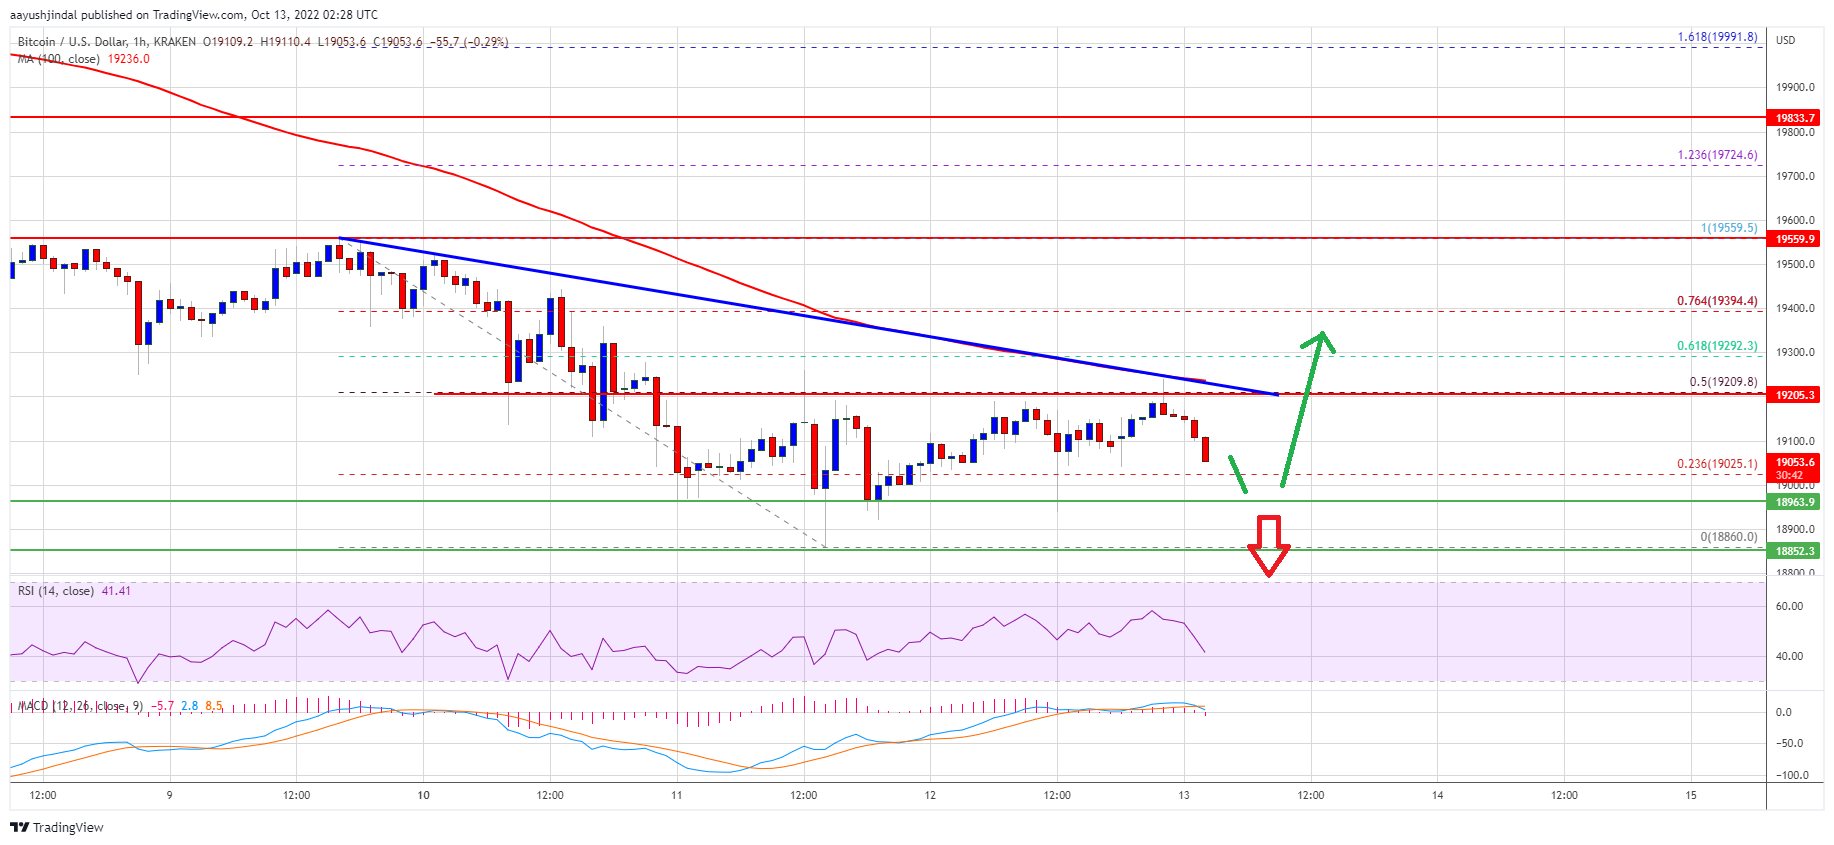
It is now trading below above $19,400 and the 100 hourly simple moving average. It seems like there is a short-term inverse head and shoulders pattern forming with breakdown support at $18,950. On the upside, an immediate resistance is near the $19,200 level. There is also a new connecting bearish trend line forming with resistance near $19,200 on the hourly chart of the BTC/USD pair.
Source: BTCUSD on TradingView.com
A clear move above the trend line might send the price towards the $19,500 resistance. Any more gains might start a steady increase towards the $20,000 resistance zone.
More Losses in BTC?
If bitcoin fails to rise above the $19,200 resistance zone, it could continue to move down. An immediate support on the downside is near the $18,950 zone.
The next major support is near the $18,860 zone. A downside break below the $18,860 support zone send the price towards the $18,550 level. Any more losses might call for a drop towards the $17,800 support zone.
Technical indicators:
Hourly MACD – The MACD is now gaining pace in the bearish zone.
Hourly RSI (Relative Strength Index) – The RSI for BTC/USD is now below the 50 level.
Major Support Levels – $18,950, followed by $18,860.
Major Resistance Levels – $19,200, $19,500 and $20,000.
Bitcoin price is consolidating near the $19,000 level against the US Dollar. BTC seems to be forming a short-term bullish pattern and might rise towards $20,000.
Bitcoin is struggling to gain pace for a move above the $19,200 level.
The price is trading below above $19,400 and the 100 hourly simple moving average.
There is a new connecting bearish trend line forming with resistance near $19,200 on the hourly chart of the BTC/USD pair (data feed from Kraken).
The pair could start a fresh increase unless there is a clear move below the $18,950 level.
Bitcoin price was seen trading in a range below the $20,000 resistance zone. BTC even settled below the $19,500 level and the 100 hourly simple moving average.
The last swing low was formed near $18,860 before there was a minor upside correction. The price was able to clear the 23.6% Fib retracement level of the downward move from the $19,560 swing high to $18,860 low. The bulls even pushed the price above the $19,200 level.
However, the bears were active above the $19,200 level. Bitcoin price struggled to clear the 50% Fib retracement level of the downward move from the $19,560 swing high to $18,860 low.
It is now trading below above $19,400 and the 100 hourly simple moving average. It seems like there is a short-term inverse head and shoulders pattern forming with breakdown support at $18,950. On the upside, an immediate resistance is near the $19,200 level. There is also a new connecting bearish trend line forming with resistance near $19,200 on the hourly chart of the BTC/USD pair.
Source: BTCUSD on TradingView.com
A clear move above the trend line might send the price towards the $19,500 resistance. Any more gains might start a steady increase towards the $20,000 resistance zone.
If bitcoin fails to rise above the $19,200 resistance zone, it could continue to move down. An immediate support on the downside is near the $18,950 zone.
The next major support is near the $18,860 zone. A downside break below the $18,860 support zone send the price towards the $18,550 level. Any more losses might call for a drop towards the $17,800 support zone.
Technical indicators:
Hourly MACD – The MACD is now gaining pace in the bearish zone.
Hourly RSI (Relative Strength Index) – The RSI for BTC/USD is now below the 50 level.
Major Support Levels – $18,950, followed by $18,860.
Major Resistance Levels – $19,200, $19,500 and $20,000.
Tags: bitcoinbtcusdBTCUSDTxbtusd
NewsBTCRead More
The Bitcoin and Ethereum prices have rebounded from last week’s lows, providing optimism that the…
Bitcoin is tightening between two major liquidity pools, with both bulls and bears sitting on…
Bitcoin Magazine Goldman Sachs Discloses $1.1 Billion Position in Bitcoin ETF Holdings Wall Street’s Goldman…
Bitcoin Magazine Bitcoin-Backed Bonds Facing Stress Test After Bitcoin Selloff, S&P Says Wall Street’s first…
Strategy Executive Chairman Michael Saylor affirmed the firm’s commitment to a long-term bitcoin strategy following…
What to Know: Wintermute warns the AI sector’s massive capital needs could drain liquidity from…