Bitcoin price failed to clear the $60,650 resistance. BTC is now correcting gains and might decline toward the $57,500 support zone.
Bitcoin is correcting gains and trading well below the $60,000 level.
The price is trading below $58,800 and the 100 hourly Simple moving average.
There was a break below a key bullish trend line with support at $60,000 on the hourly chart of the BTC/USD pair (data feed from Kraken).
The pair could climb again if it stays above the $57,500 support zone.
Bitcoin price started a decent increase after it broke the $58,500 resistance zone. BTC was able to climb above the $59,500 resistance. The pair even cleared the $60,000 resistance zone.
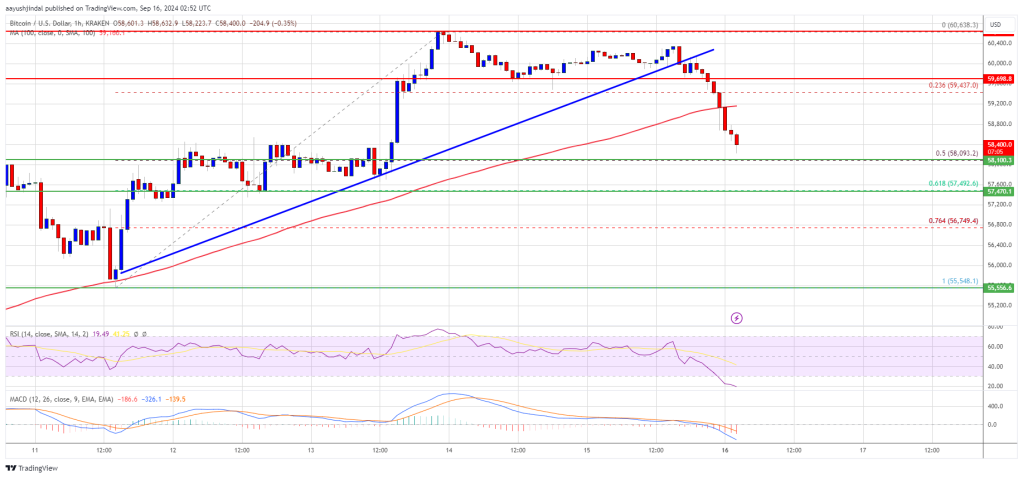
However, the bears seem to be active near the $60,650 resistance zone. A high was formed at $60,638 and the price is now correcting gains. There was a drop below the $59,500 level. The price even dipped below the 23.6% Fib retracement level of the upward move from the $55,548 swing low to the $60,638 high.
There was also a break below a key bullish trend line with support at $60,000 on the hourly chart of the BTC/USD pair. Bitcoin is now trading below $58,800 and the 100 hourly Simple moving average.
On the upside, the price could face resistance near the $59,200 level. The first key resistance is near the $60,000 level. A clear move above the $60,000 resistance might start a steady increase in the coming sessions. The next key resistance could be $60,650. A close above the $60,650 resistance might spark more upsides. In the stated case, the price could rise and test the $62,000 resistance.
If Bitcoin fails to rise above the $59,200 resistance zone, it could continue to move down. Immediate support on the downside is near the $58,000 level or the 50% Fib retracement level of the upward move from the $55,548 swing low to the $60,638 high.
The first major support is $57,500. The next support is now near the $56,750 zone. Any more losses might send the price toward the $55,550 support in the near term.
Technical indicators:
Hourly MACD – The MACD is now gaining pace in the bearish zone.
Hourly RSI (Relative Strength Index) – The RSI for BTC/USD is now below the 50 level.
Major Support Levels – $58,000, followed by $57,500.
Major Resistance Levels – $59,200, and $60,000.
[#item_full_content]NewsBTCRead MoreYour day-ahead look for July 22, 2026Read MoreCoinDesk: Bitcoin, Ethereum, Crypto News and Price Data[#item_full_content]
BTC retreated from a one-month high as WTI crude topped $85 for the first time…
An attacker fed the lending system a fake, abnormally low bitcoin price, liquidated vaults that…
A two-day chip rebound stalled ahead of Alphabet's earnings in a sign of whether the…
Semiconductor stocks led a second day of gains on AI optimism, while the yen slid…
Bitcoin Magazine Bitcoin Maxi Jack Dorsey Unveils New Open Source Group Chat App Tech entrepreneur…