Bitcoin price started another decline from the $59,500 level. BTC is moving lower, and the bears could gain strength below the $56,000 support.
Bitcoin started another decline from the $59,500 resistance zone.
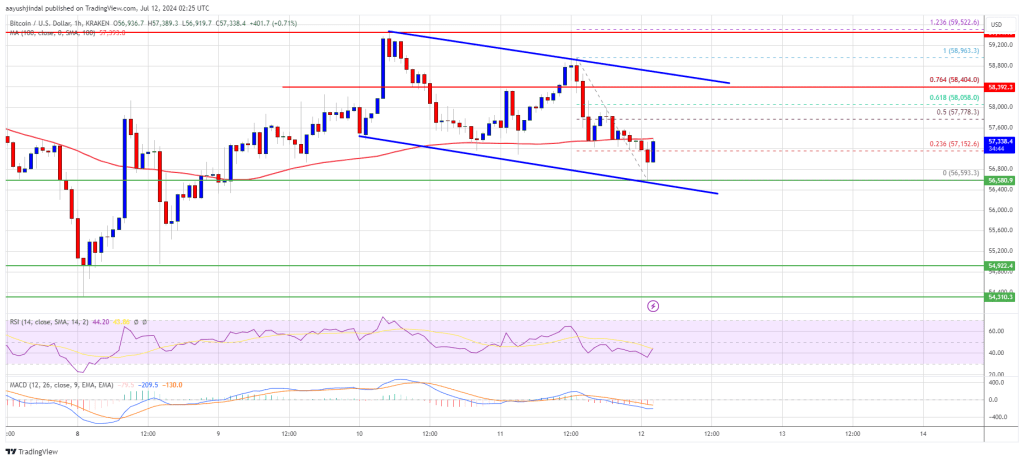
The price is trading below $57,500 and the 100 hourly Simple moving average.
There is a key declining channel forming with resistance at $58,400 on the hourly chart of the BTC/USD pair (data feed from Kraken).
The pair might continue to move down if it fails to stay above the $56,500 support.
Bitcoin price struggled to clear the $59,500 and $60,000 resistance levels. BTC peaked near the $59,500 resistance zone and recently started another decline. There was a move below the $58,500 level.
The price declined below the $57,800 and $57,500 support levels. It tested the $56,600 zone. A low was formed at $56,593 and the price is now consolidating losses. It is trading near the 23.6% Fib retracement level of the downward move from the $58,963 swing high to the $56,593 low.
Bitcoin price is now trading below $57,500 and the 100 hourly Simple moving average. Immediate resistance on the upside is near the $57,750 level. The first key resistance is near the $58,000 level or the 61.8% Fib retracement level of the downward move from the $58,963 swing high to the $56,593 low.
A clear move above the $58,000 resistance might start a decent increase in the coming sessions. The next key resistance could be $58,500. There is also a key declining channel forming with resistance at $58,400 on the hourly chart of the BTC/USD pair.
The next major hurdle sits at $59,500. A close above the $59,500 resistance might start a steady increase and send the price higher. In the stated case, the price could rise and test the $60,000 resistance.
If Bitcoin fails to climb above the $58,000 resistance zone, it could continue to move down. Immediate support on the downside is near the $56,600 level.
The first major support is $56,000. The next support is now near $55,000. Any more losses might send the price toward the $53,500 support zone in the near term.
Technical indicators:
Hourly MACD – The MACD is now gaining pace in the bearish zone.
Hourly RSI (Relative Strength Index) – The RSI for BTC/USD is now below the 50 level.
Major Support Levels – $56,500, followed by $55,000.
Major Resistance Levels – $58,000, and $58,500.
[#item_full_content]NewsBTCRead MoreA 50% drop from recent highs has pushed the asset into a zone historically labeled…
Bitcoin Magazine Bitcoin Price Crashes Toward $61,000 as Bloodbath Engulfs Crypto Stocks Bitcoin price is…
A strengthening U.S. dollar and the Fed's hawkish turn under new chair Kevin Warsh may…
Precious metals have fallen sharply from their 2025 highs as markets price in Fed rate…
Bitcoin Magazine BlackRock Tells Investors to Put Bitcoin in Their Portfolios BlackRock, the world’s largest…
Bitcoin Magazine Strive (ASST) CEO Says Company Is Buying Bitcoin ‘Hand Over Fist’ as Treasury…