Bitcoin price started a recovery wave above $68,500. BTC is now struggling to clear $72,000 and might start another decline in the near term.
Bitcoin is attempting to recover but is facing many hurdles near $72,000.
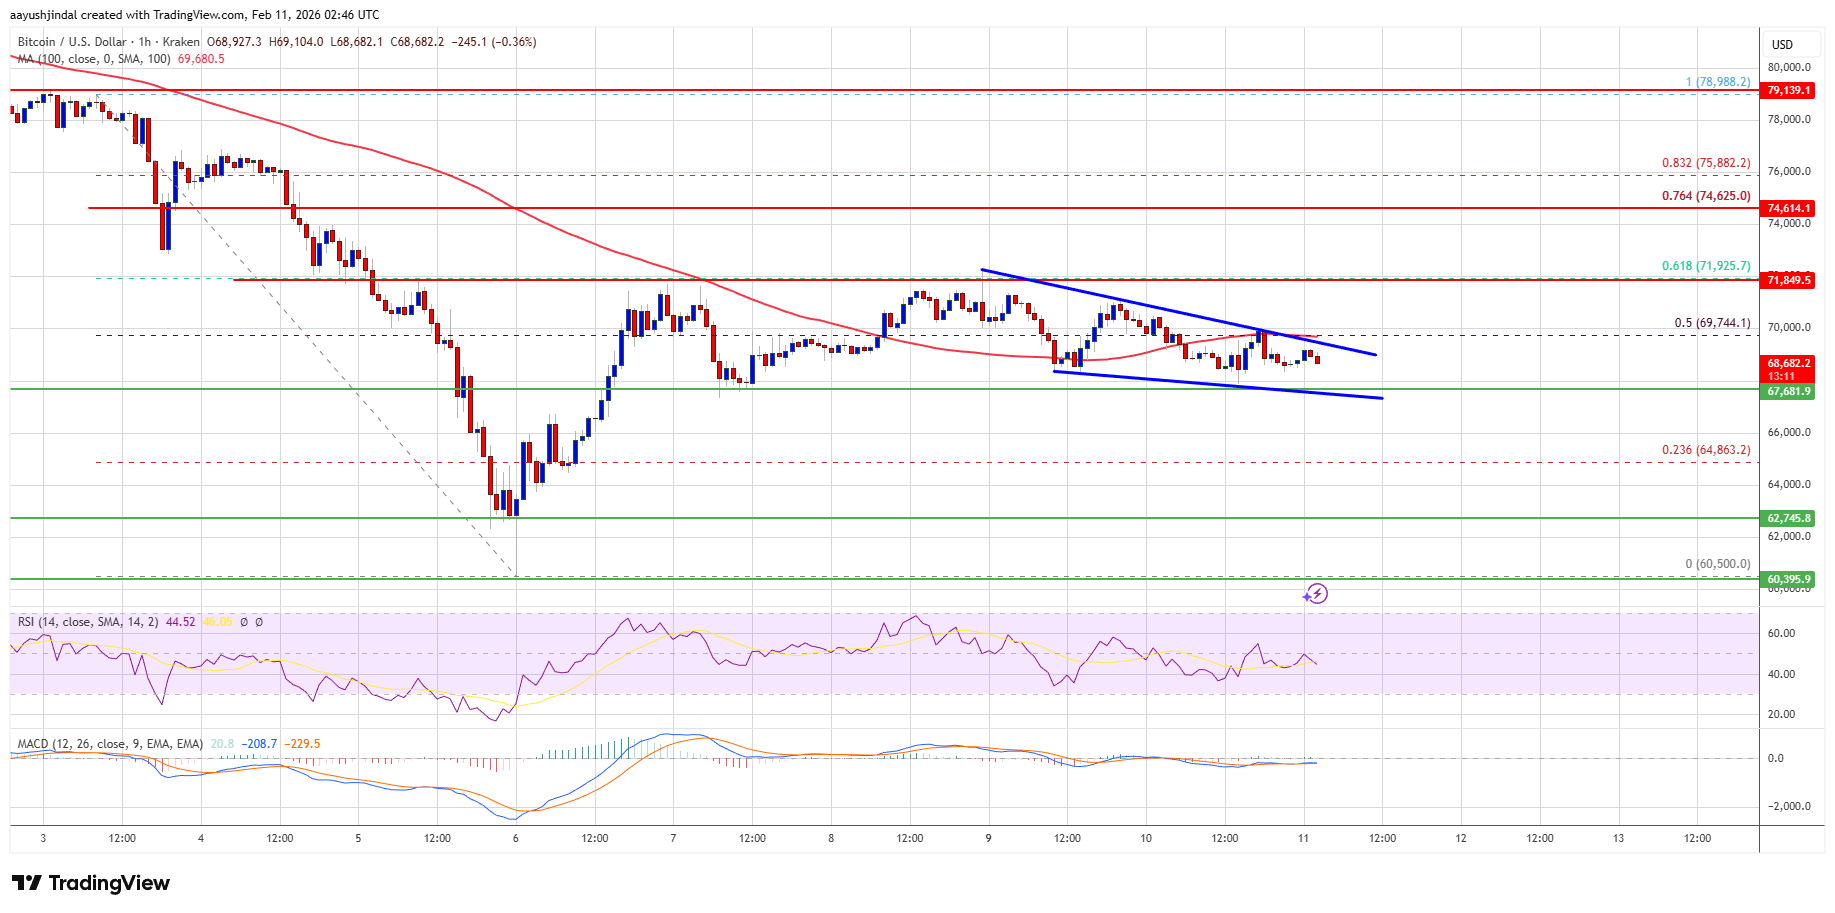
The price is trading below $70,000 and the 100 hourly simple moving average.
There is a short-term bearish trend line forming with resistance at $69,200 on the hourly chart of the BTC/USD pair (data feed from Kraken).
The pair might dip again if it trades below the $68,000 and $67,700 levels.
Bitcoin price managed to remain stable above the $66,500 zone. BTC started a recovery wave and was able to climb above the $68,000 resistance zone.
The price surpassed the 50% Fib retracement level of the downward move from the $78,988 swing high to the $60,500 low. However, the bears seem to be active near the $72,200 and $72,500 levels. Besides, there is a short-term bearish trend line forming with resistance at $69,200 on the hourly chart of the BTC/USD pair.
Bitcoin is now trading below $70,000 and the 100 hourly simple moving average. If the price remains stable above $68,000, it could attempt a fresh increase. Immediate resistance is near the $69,200 level and the trend line.
The first key resistance is near the $71,000 level. A close above the $71,000 resistance might send the price further higher. In the stated case, the price could rise and test the $72,000 resistance or the 61.8% Fib retracement level of the downward move from the $78,988 swing high to the $60,500 low. Any more gains might send the price toward the $73,500 level. The next barrier for the bulls could be $74,000 and $74,500.
If Bitcoin fails to rise above the $71,500 resistance zone, it could start another decline. Immediate support is near the $68,000 level. The first major support is near the $67,650 level.
The next support is now near the $65,500 zone. Any more losses might send the price toward the $65,000 support in the near term. The main support now sits at $63,200, below which BTC might struggle to recover in the near term.
Technical indicators:
Hourly MACD – The MACD is now gaining pace in the bearish zone.
Hourly RSI (Relative Strength Index) – The RSI for BTC/USD is now below the 50 level.
Major Support Levels – $68,000, followed by $67,600.
Major Resistance Levels – $71,500 and $72,000.
[#item_full_content]NewsBTCRead MoreBitcoin Magazine Paraguay Adopts Stricter Crypto Oversight, Mandates Detailed Transaction on Bitcoin Reporting Paraguay’s National…
Bitcoin Magazine Policy Group Calls for Bitcoin Inclusion in Proposed Crypto Tax Exemption The Bitcoin…
Bitcoin Magazine Corporate Bitcoin Holdings Hit Record High as Institutions Accumulate 2.8x Mining Supply: Report…
Research shows that only 8% to 10% of global Bitcoin hashrate runs in oil-sensitive power…
Today’s quantum computers are far from breaking Bitcoin’s cryptography and any real threat would likely…
U.S. President Trump said stopping Iran is more of a concern than oil prices, as…