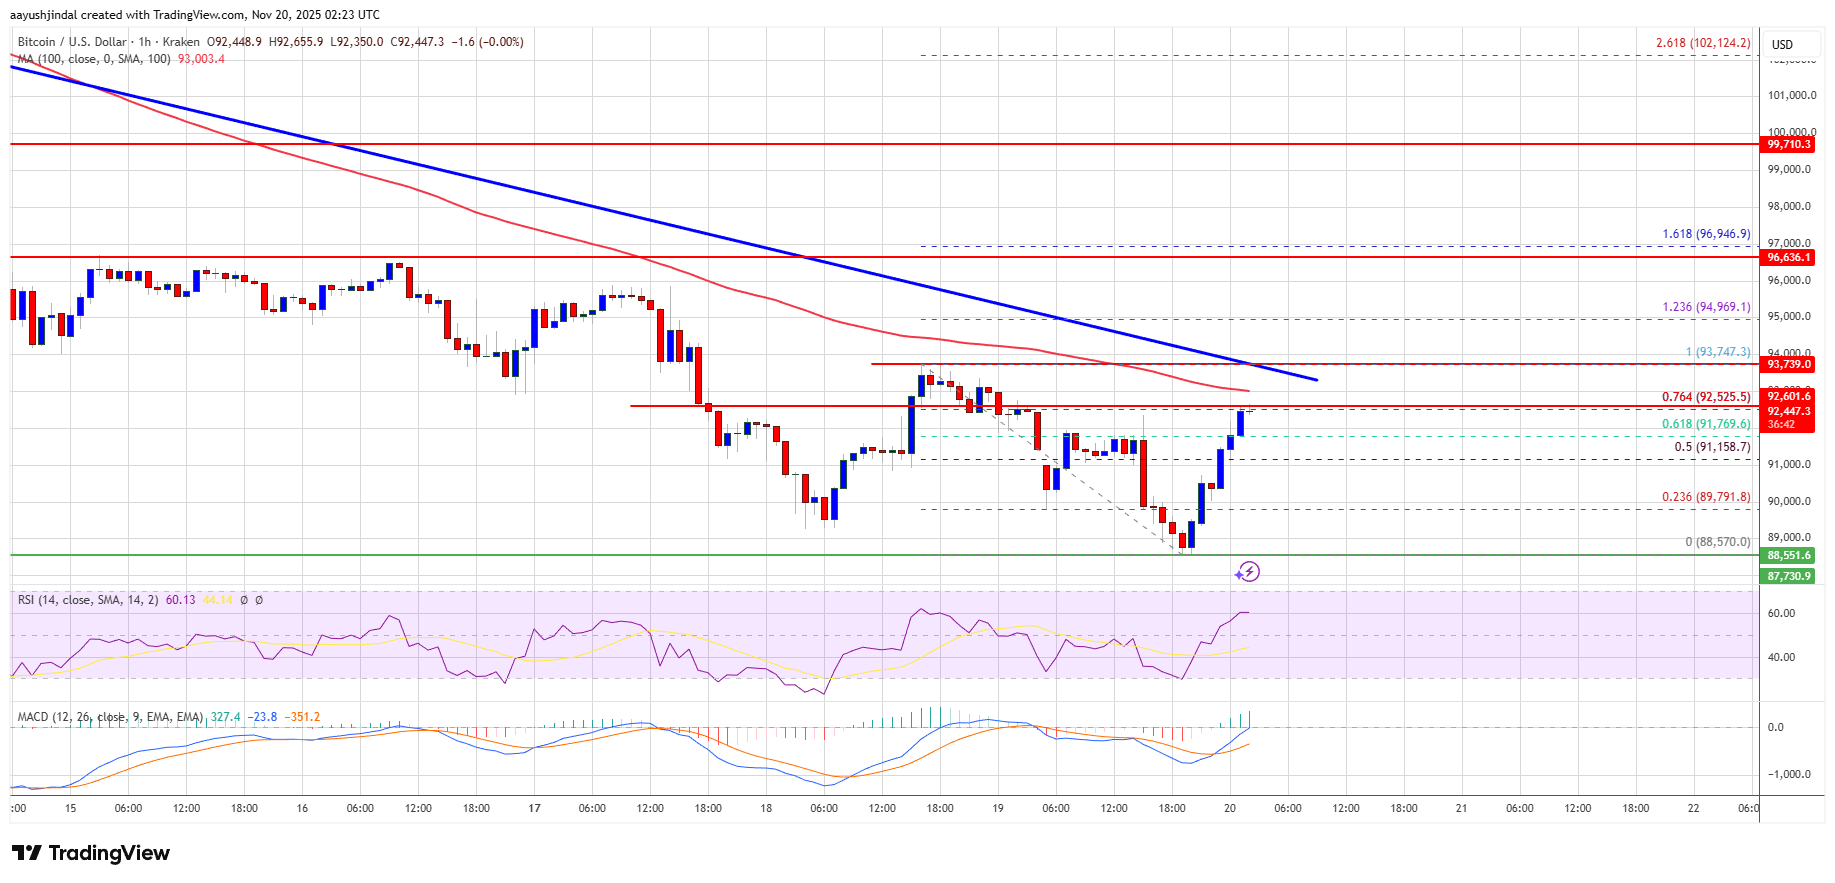
Bitcoin price found support near $88,500. BTC is now correcting some losses but faces many hurdles near $92,500 and $93,500.
Bitcoin started a fresh decline below $93,000 and $92,500.
The price is trading below $93,000 and the 100 hourly Simple moving average.
There is a bearish trend line forming with resistance at $93,500 on the hourly chart of the BTC/USD pair (data feed from Kraken).
The pair might continue to move down if it settles below the $90,000 zone.
Bitcoin price failed to stay in a positive zone above the $92,000 level. BTC bears remained active below $92,000 and pushed the price lower.
The bears gained strength and were able to push the price below the $89,500 zone. A low was formed at $88,570, and the price is now attempting a recovery wave. There was a move above the 50% Fib retracement level of the recent decline from the $93,747 swing high to the $88,570 low.
Bitcoin is now trading below $93,000 and the 100 hourly Simple moving average. Besides, there is a bearish trend line forming with resistance at $93,500 on the hourly chart of the BTC/USD pair.
If the bulls attempt another recovery wave, the price could face resistance near the $92,500 level and the 76.4% Fib retracement level of the recent decline from the $93,747 swing high to the $88,570 low. The first key resistance is near the $93,500 level and the trend line.
The next resistance could be $93,750. A close above the $93,750 resistance might send the price further higher. In the stated case, the price could rise and test the $94,500 resistance. Any more gains might send the price toward the $95,000 level. The next barrier for the bulls could be $95,500 and $96,200.
If Bitcoin fails to rise above the $93,500 resistance zone, it could start another decline. Immediate support is near the $91,150 level. The first major support is near the $90,500 level.
The next support is now near the $90,000 zone. Any more losses might send the price toward the $88,500 support in the near term. The main support sits at $86,500, below which BTC might accelerate lower in the near term.
Technical indicators:
Hourly MACD – The MACD is now losing pace in the bearish zone.
Hourly RSI (Relative Strength Index) – The RSI for BTC/USD is now above the 50 level.
Major Support Levels – $91,150, followed by $90,500.
Major Resistance Levels – $92,500 and $93,500.
[#item_full_content]NewsBTCRead MoreEach escalation in the Iran conflict has been larger than the last, but each bitcoin…
The Bitcoin price has not particularly impressed over the past two weeks, but it appears…
Bitcoin’s extended pullback from its all-time high has left traders in uncertainty, and many investors…
Bitcoin recently pushed into a key liquidity pocket near the $73,000 level, briefly tapping overhead…
The price of Bitcoin put in another interesting performance over the past week, as the…
Strategy’s stock is trading below the value of its own Bitcoin holdings — an unusual…