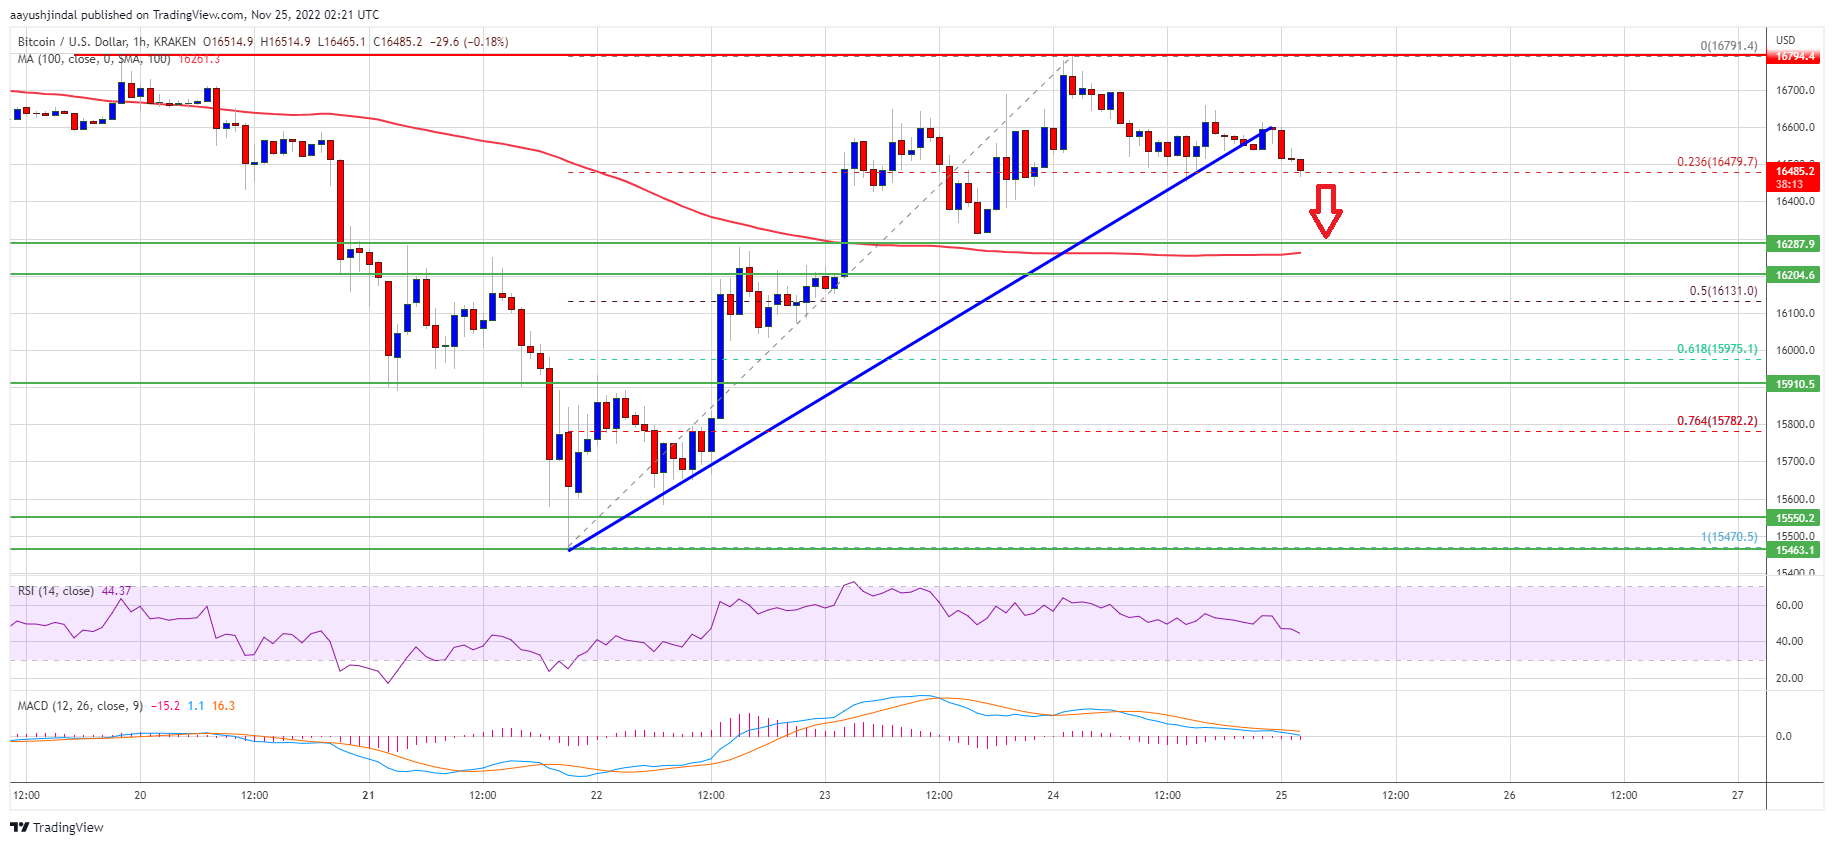
Bitcoin price struggled to clear the $17,000 resistance. BTC seems to be forming a double top pattern and might dive below the $16,000 support.
Bitcoin attempted an upside break above the $17,000 resistance, but failed.
The price is trading above $16,300 and the 100 hourly simple moving average.
There was a break below a key bullish trend line with support near $16,420 on the hourly chart of the BTC/USD pair (data feed from Kraken).
The pair could continue to decline if it breaks the $16,000 support zone.
Bitcoin price attempted a recovery wave from the $15,500 support zone. BTC climbed above the $16,000 and $16,500 resistance levels.
It even settled above the $16,300 level and the 100 hourly simple moving average. However, the bears were active near the $16,800 zone. It seems like the price faced another major rejection near the $16,800 level and is forming a double top pattern.
Bitcoin price started a fresh decline from the $16,800 zone. There was a break below a key bullish trend line with support near $16,420 on the hourly chart of the BTC/USD pair.
It is now approaching the 23.6% Fib retracement level of the recent increase from the $15,470 swing low to $16,791 high. Besides, it is trading above $16,300 and the 100 hourly simple moving average. On the upside, an immediate resistance is near the $16,600 level.
Source: BTCUSD on TradingView.com
The first major resistance is near the $16,800 zone. A successful move above the $16,800 resistance might start a real recovery wave. The next major resistance is near $17,000, above which the price could gain pace for a move towards the $17,500 zone.
If bitcoin fails to climb above the $16,800 resistance, it could continue to move down. An immediate support on the downside is near the $16,280 level and the 100 hourly simple moving average.
The next major support is near the $16,130 zone or the 50% Fib retracement level of the recent increase from the $15,470 swing low to $16,791 high, below which the price might gain bearish momentum. In the stated case, the price might drop towards the $15,500 support zone.
Technical indicators:
Hourly MACD – The MACD is now gaining pace in the bearish zone.
Hourly RSI (Relative Strength Index) – The RSI for BTC/USD is now below the 50 level.
Major Support Levels – $16,280, followed by $16,130.
Major Resistance Levels – $16,800, $17,000 and $18,000.
Bitcoin price struggled to clear the $17,000 resistance. BTC seems to be forming a double top pattern and might dive below the $16,000 support.
Bitcoin attempted an upside break above the $17,000 resistance, but failed.
The price is trading above $16,300 and the 100 hourly simple moving average.
There was a break below a key bullish trend line with support near $16,420 on the hourly chart of the BTC/USD pair (data feed from Kraken).
The pair could continue to decline if it breaks the $16,000 support zone.
Bitcoin price attempted a recovery wave from the $15,500 support zone. BTC climbed above the $16,000 and $16,500 resistance levels.
It even settled above the $16,300 level and the 100 hourly simple moving average. However, the bears were active near the $16,800 zone. It seems like the price faced another major rejection near the $16,800 level and is forming a double top pattern.
Bitcoin price started a fresh decline from the $16,800 zone. There was a break below a key bullish trend line with support near $16,420 on the hourly chart of the BTC/USD pair.
It is now approaching the 23.6% Fib retracement level of the recent increase from the $15,470 swing low to $16,791 high. Besides, it is trading above $16,300 and the 100 hourly simple moving average. On the upside, an immediate resistance is near the $16,600 level.
Source: BTCUSD on TradingView.com
The first major resistance is near the $16,800 zone. A successful move above the $16,800 resistance might start a real recovery wave. The next major resistance is near $17,000, above which the price could gain pace for a move towards the $17,500 zone.
If bitcoin fails to climb above the $16,800 resistance, it could continue to move down. An immediate support on the downside is near the $16,280 level and the 100 hourly simple moving average.
The next major support is near the $16,130 zone or the 50% Fib retracement level of the recent increase from the $15,470 swing low to $16,791 high, below which the price might gain bearish momentum. In the stated case, the price might drop towards the $15,500 support zone.
Technical indicators:
Hourly MACD – The MACD is now gaining pace in the bearish zone.
Hourly RSI (Relative Strength Index) – The RSI for BTC/USD is now below the 50 level.
Major Support Levels – $16,280, followed by $16,130.
Major Resistance Levels – $16,800, $17,000 and $18,000.
Tags: bitcoinbitcoin pricebtcusdBTCUSDTxbtusd
NewsBTCRead More
Bitcoin fell to nearly $77,600 on Tuesday before clawing most of it back, leaving it…
Bitcoin Magazine CoinCorner Launches Lloyd’s-Insured Multisig Bitcoin Vault with AnchorWatch British bitcoin exchange CoinCorner has…
Bitcoin Magazine Capital B Buys 376 Bitcoins in Its Biggest Purchase of 2026 European bitcoin…
Bitcoin Magazine Strategy Halted Its Bitcoin Buys Again Last Week Bitcoin treasury Strategy has halted…
Bitcoin Magazine Castle Opens Its Bitcoin Savings Stack to Individuals Castle, the company behind an…
A string of incidents involving Coldcard, Lightning and Liquid highlights how AI is changing the…