Bitcoin price recovered further above $43,500 but struggled near $44,500. BTC is correcting gains and might test the $42,150 support zone.
Bitcoin recovered above the $43,500 resistance and remained in a positive zone.
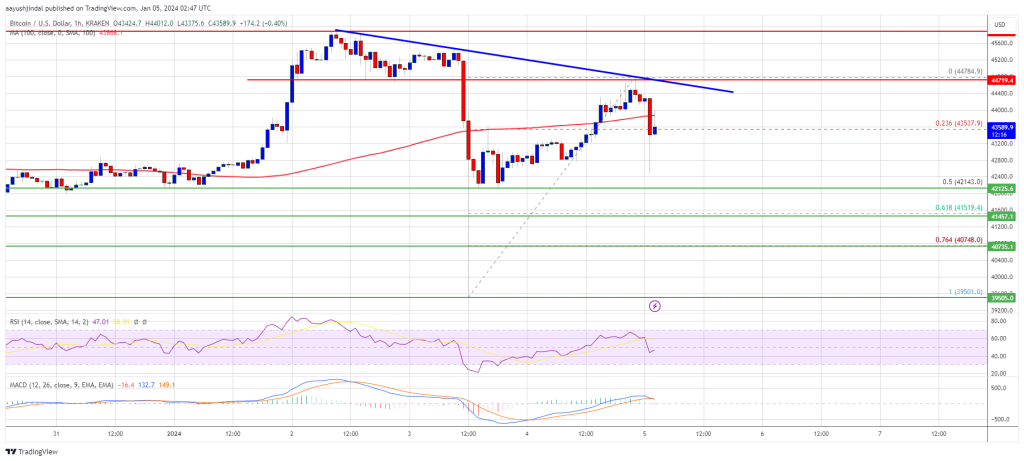
The price is trading below $44,000 and the 100 hourly Simple moving average.
There is a key bearish trend line forming with resistance near $44,400 on the hourly chart of the BTC/USD pair (data feed from Kraken).
The pair could decline toward the $42,150 and $42,000 support levels.
Bitcoin price started a recovery wave above the $43,200 resistance zone. BTC even broke the $43,500 resistance zone to move further into a positive zone.
There was a decent upward move, but the bears were active near the $44,500 resistance zone. It faced rejection near the 76.4% Fib retracement level of the downward move from the $45,913 swing high to the $39,500 low. A high was formed near $44,784 and the price is now correcting gains.
There was a move below the $44,000 level. The price traded below the 23.6% Fib retracement level of the upward move from the $39,501 swing low to the $44,784 high. Bitcoin is now trading below $44,000 and the 100 hourly Simple moving average.
On the upside, immediate resistance is near the $44,000 level. The first major resistance is $44,400. There is also a key bearish trend line forming with resistance near $44,400 on the hourly chart of the BTC/USD pair.
Source: BTCUSD on TradingView.com
A close above the $44,400 level could send the price further higher. The next major resistance sits at $45,500. Any more gains above the $45,500 level could open the doors for a move toward the $46,000 level.
If Bitcoin fails to rise above the $44,400 resistance zone, it could start a fresh decline. Immediate support on the downside is near the $42,800 level.
The next major support is near $42,150 or the 50% Fib retracement level of the upward move from the $39,501 swing low to the $44,784 high. If there is a move below $41,150, the price could gain bearish momentum. In the stated case, the price could drop toward the $40,500 support in the near term.
Technical indicators:
Hourly MACD – The MACD is now losing pace in the bullish zone.
Hourly RSI (Relative Strength Index) – The RSI for BTC/USD is now below the 50 level.
Major Support Levels – $42,800, followed by $42,150.
Major Resistance Levels – $43,800, $44,000, and $44,400.
[#item_full_content]NewsBTCRead MoreStrategy, the Michael Saylor-led company that has made Bitcoin accumulation its core business, bought $76.6…
Bitcoin Magazine Bitcoin Volatility Falls as Asset Matures, Charles Schwab Report Finds A new report…
A crypto analyst who correctly predicted Bitcoin’s (BTC) cycle peak around $125,000 has released a…
Bitcoin Magazine Bitwise Joins Lombard’s Bitcoin Smart Accounts to Help Unlock Institutional Yield Bitwise Asset…
Bitcoin Magazine Morgan Stanley Moves Closer to Bitcoin ETF Launch With NYSE Listing Announcement Morgan…
Bitcoin Magazine As Bitcoin Consolidates, Signs Point to Potential Bottom Amid Market Calm: Research Bitcoin’s…