Bitcoin price dived toward the $38,500 support zone. BTC is attempting a recovery wave and might struggle to climb above the $40,500 resistance.
Bitcoin price extended its decline and tested the $38,500 support zone.
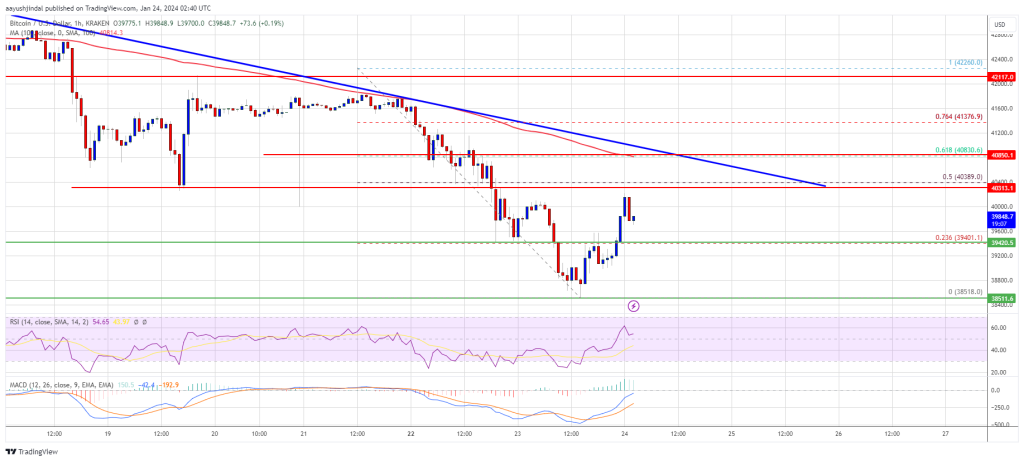
The price is trading below $40,000 and the 100 hourly Simple moving average.
There is a key bearish trend line forming with resistance near $40,450 on the hourly chart of the BTC/USD pair (data feed from Kraken).
The pair might struggle to recover above the $40,000 and $40,500 resistance levels.
Bitcoin price remained in a bearish zone below the $40,000 support zone. BTC extended its decline and traded below the $49,200 level. Finally, it tested the $38,500 support zone, as discussed in yesterday’s post.
A new weekly low was formed near $38,518 and the price is now correcting losses. It is slowly recovering above the $39,000 level. It cleared the 23.6% Fib retracement level of the downward move from the $42,260 swing high to the $38,518 low.
Bitcoin is now trading below $40,000 and the 100 hourly Simple moving average. Immediate resistance is near the $40,000 level. The first major resistance is near the $40,350 level or the 50% Fib retracement level of the downward move from the $42,260 swing high to the $38,518 low.
Source: BTCUSD on TradingView.com
There is also a key bearish trend line forming with resistance near $40,450 on the hourly chart of the BTC/USD pair. A clear move above the $40,450 resistance could send the price toward the $40,850 resistance. The next resistance is now forming near the $41,250 level. A close above the $41,250 level could push the price further higher. The next major resistance sits at $42,000.
If Bitcoin fails to rise above the $40,450 resistance zone, it could start another decline. Immediate support on the downside is near the $39,400 level.
The next major support is $39,000. If there is a close below $39,000, the price could gain bearish momentum. In the stated case, the price could revisit the $38,500 support in the near term.
Technical indicators:
Hourly MACD – The MACD is now losing pace in the bearish zone.
Hourly RSI (Relative Strength Index) – The RSI for BTC/USD is now above the 50 level.
Major Support Levels – $39,400, followed by $38,500.
Major Resistance Levels – $40,350, $40,450, and $40,850.
[#item_full_content]NewsBTCRead MoreSpot bitcoin funds lost about $95 million on Thursday and ether funds roughly $52 million,…
A smoother long-term MACD just flipped bullish, pointing to more upside. Here are key levels…
Bitcoin is up 4.2% over seven days that contained an oil shock, a bond selloff…
A sharp rise in the yen has left bitcoin and other major cryptocurrencies underperforming in…
At its last stage for government approval, the state's executive council rejected the bond project…
Bitcoin Magazine JPMorgan Says the Real Threat to Bitcoin Isn’t Strategy (MSTR) — It’s Private…