Bitcoin price dived toward the $38,500 support zone. BTC is attempting a recovery wave and might struggle to climb above the $40,500 resistance.
Bitcoin price extended its decline and tested the $38,500 support zone.
The price is trading below $40,000 and the 100 hourly Simple moving average.
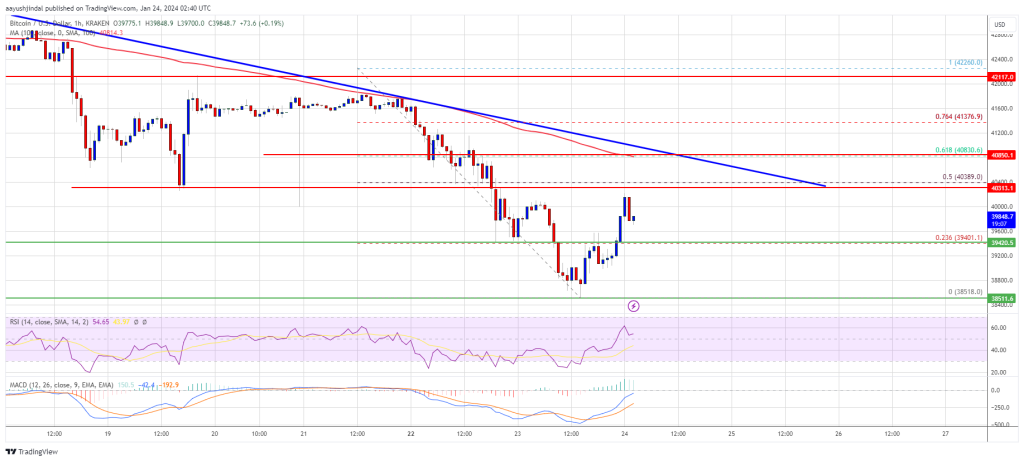
There is a key bearish trend line forming with resistance near $40,450 on the hourly chart of the BTC/USD pair (data feed from Kraken).
The pair might struggle to recover above the $40,000 and $40,500 resistance levels.
Bitcoin price remained in a bearish zone below the $40,000 support zone. BTC extended its decline and traded below the $49,200 level. Finally, it tested the $38,500 support zone, as discussed in yesterday’s post.
A new weekly low was formed near $38,518 and the price is now correcting losses. It is slowly recovering above the $39,000 level. It cleared the 23.6% Fib retracement level of the downward move from the $42,260 swing high to the $38,518 low.
Bitcoin is now trading below $40,000 and the 100 hourly Simple moving average. Immediate resistance is near the $40,000 level. The first major resistance is near the $40,350 level or the 50% Fib retracement level of the downward move from the $42,260 swing high to the $38,518 low.
Source: BTCUSD on TradingView.com
There is also a key bearish trend line forming with resistance near $40,450 on the hourly chart of the BTC/USD pair. A clear move above the $40,450 resistance could send the price toward the $40,850 resistance. The next resistance is now forming near the $41,250 level. A close above the $41,250 level could push the price further higher. The next major resistance sits at $42,000.
If Bitcoin fails to rise above the $40,450 resistance zone, it could start another decline. Immediate support on the downside is near the $39,400 level.
The next major support is $39,000. If there is a close below $39,000, the price could gain bearish momentum. In the stated case, the price could revisit the $38,500 support in the near term.
Technical indicators:
Hourly MACD – The MACD is now losing pace in the bearish zone.
Hourly RSI (Relative Strength Index) – The RSI for BTC/USD is now above the 50 level.
Major Support Levels – $39,400, followed by $38,500.
Major Resistance Levels – $40,350, $40,450, and $40,850.
[#item_full_content]NewsBTCRead MoreThe average public miner spent $79,995 to produce one bitcoin last quarter. Bitcoin is trading…
Investor sentiment in the crypto market sits at its lowest point in months — and…
A veteran Bitcoin evangelist who entered the market when most people had never heard the…
Bitcoin Magazine Morgan Stanley Set to Undercut Bitcoin ETF Rivals With 0.14% Fee Ahead of…
US lawmakers on Friday unveiled the Digital Asset PARITY Act — a wide‑ranging draft bill…
The bank priced its proposed spot bitcoin fund at 14 basis points, making it the…