Bitcoin price gained pace and tested the $65,000 resistance. BTC must clear $65,000 to continue higher in the near term.
Bitcoin started a steady increase above the $63,000 zone.
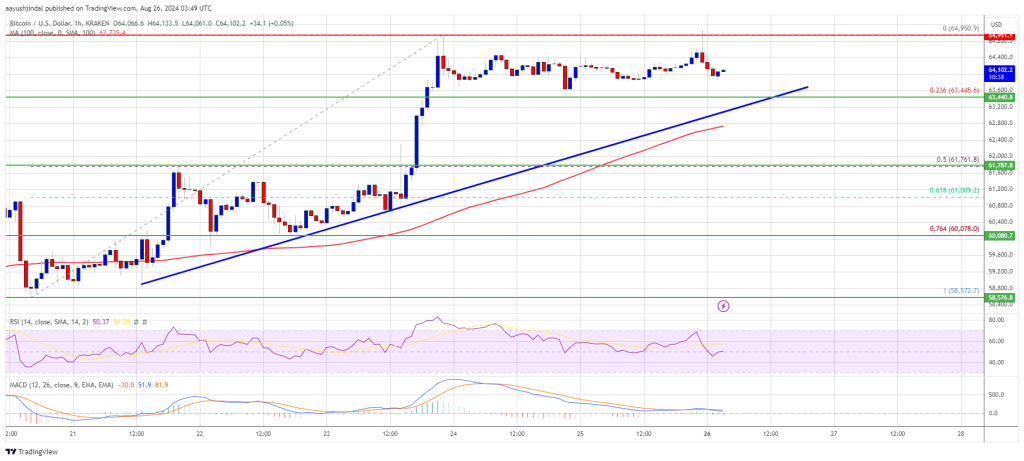
The price is trading above $63,500 and the 100 hourly Simple moving average.
There is a key bullish trend line forming with support at $63,450 on the hourly chart of the BTC/USD pair (data feed from Kraken).
The pair might attempt a fresh increase if it clears the $65,000 resistance zone.
Bitcoin price remained stable above the $60,000 pivot level. BTC formed a base and started a steady increase above the $62,000 resistance zone. The price climbed above the $63,200 and $63,500 resistance levels.
Finally, the bears appeared near the $65,000 resistance zone. A high was formed at $64,950 and the price is now consolidating gains. There was a minor decline below the $64,500 level. The price tested the 23.6% Fib retracement level of the upward move from the $58,572 swing low to the $64,950 high.
Bitcoin is now trading above $63,200 and the 100 hourly Simple moving average. There is also a key bullish trend line forming with support at $63,450 on the hourly chart of the BTC/USD pair.
On the upside, the price could face resistance near the $64,500 level. The first key resistance is near the $65,000 level. A clear move above the $65,000 resistance might send the price further higher in the coming sessions. The next key resistance could be $65,500.
A close above the $65,500 resistance might spark more upsides. In the stated case, the price could rise and test the $67,200 resistance.
If Bitcoin fails to rise above the $65,000 resistance zone, it could start a downside correction. Immediate support on the downside is near the $63,800 level.
The first major support is $63,500. The next support is now near the $62,800 zone. Any more losses might send the price toward the $61,750 support zone or the 50% Fib retracement level of the upward move from the $58,572 swing low to the $64,950 high in the near term.
Technical indicators:
Hourly MACD – The MACD is now losing pace in the bullish zone.
Hourly RSI (Relative Strength Index) – The RSI for BTC/USD is now above the 50 level.
Major Support Levels – $63,800, followed by $63,500.
Major Resistance Levels – $64,500, and $65,000.
[#item_full_content]NewsBTCRead MoreFor readers tracking where the market is actually changing, this is the part that matters.…
The headline number is useful, but the real story is what it says about positioning.…
Miners must redirect their hashrate before the July 31 cutoff, as the pool will stop…
The Nasdaq-listed Korean media company once lined up $1 billion in financing to buy 10,000…
The bank said Strategy's bitcoin sales policy adds avoidable market uncertainty and should be replaced…
Bitcoin Magazine Metaplanet Adds 2,823 Bitcoin, Reaches 43,000 BTC and Becomes World’s Third-Largest Corporate Treasury…