Bitcoin price is holding gains above the $70,000 resistance. BTC is now showing positive signs and might aim for a move above the $73,000 level.
Bitcoin price extended its increase and tested the $73,000 zone.
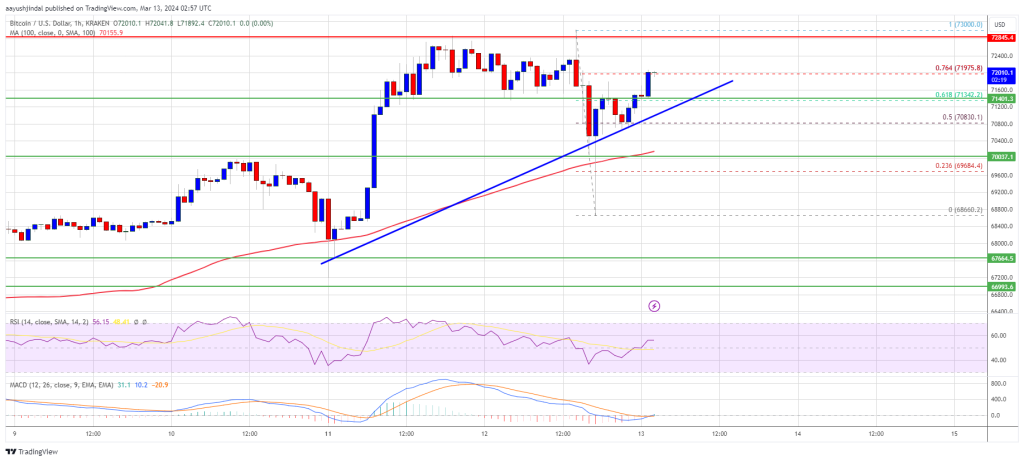
The price is trading above $71,500 and the 100 hourly Simple moving average.
There is a connecting bullish trend line forming with support at $71,300 on the hourly chart of the BTC/USD pair (data feed from Kraken).
The pair could continue to move up if it clears the $72,850 and $73,000 resistance levels.
Bitcoin price remained stable above the $70,000 level. BTC gained pace and was able to extend its increase above the $72,500 level. It even spiked above the $72,850 resistance but the upsides were limited.
The price traded to a new all-time high at $73,000 before there was a downside correction. The price declined below the $72,000 and $71,500 levels. A low was formed near $68,660 and the price is again rising. There was a move above the $71,000 level.
The price cleared the 50% Fib retracement level of the downward move from the $73,000 swing high to the $68,660 low. There is also a connecting bullish trend line forming with support at $71,300 on the hourly chart of the BTC/USD pair.
Bitcoin is now trading above $71,500 and the 100 hourly Simple moving average. Immediate resistance is near the $72,000 level and the 76.4% Fib retracement level of the downward move from the $73,000 swing high to the $68,660 low.
Source: BTCUSD on TradingView.com
The next key resistance could be $72,850, above which the price could rise toward the $73,000 resistance zone. If there is a clear move above the $73,000 resistance zone, the price could even attempt a move above the $74,000 resistance zone. Any more gains might send the price toward the $75,000 level.
If Bitcoin fails to rise above the $72,000 resistance zone, it could start a downside correction. Immediate support on the downside is near the $71,300 level and the trend line.
The first major support is $70,000 or 100 hourly SMA. If there is a close below $70,000, the price could start a decent pullback toward the $68,650 level. Any more losses might send the price toward the $66,500 support zone.
Technical indicators:
Hourly MACD – The MACD is now gaining pace in the bullish zone.
Hourly RSI (Relative Strength Index) – The RSI for BTC/USD is now above the 50 level.
Major Support Levels – $71,300, followed by $70,000.
Major Resistance Levels – $72,000, $72,850, and $73,000.
[#item_full_content]NewsBTCRead MoreBitcoin has experienced another turbulent week marked by sustained downward pressure, reinforcing the broader bearish…
Bitcoin is hovering near key liquidity zones after a week of downward momentum, and traders…
Over the past week, the Bitcoin price kept on putting in consecutive lows, with barely…
Over the past week, the Bitcoin price kept on putting in consecutive lows, with barely…
Despite the price recovery, the Crypto Fear & Greed Index remains in “extreme fear,” indicating…
Michael Saylor’s latest message is blunt and direct: “Go Bitcoin today — the money won’t…