Bitcoin price failed again to clear the $44,000 resistance zone. BTC is declining and might be at risk of a downside break below the $41,500 level.
Bitcoin is slowly moving lower from the $43,800 resistance zone.
The price is trading below $43,000 and the 100 hourly Simple moving average.
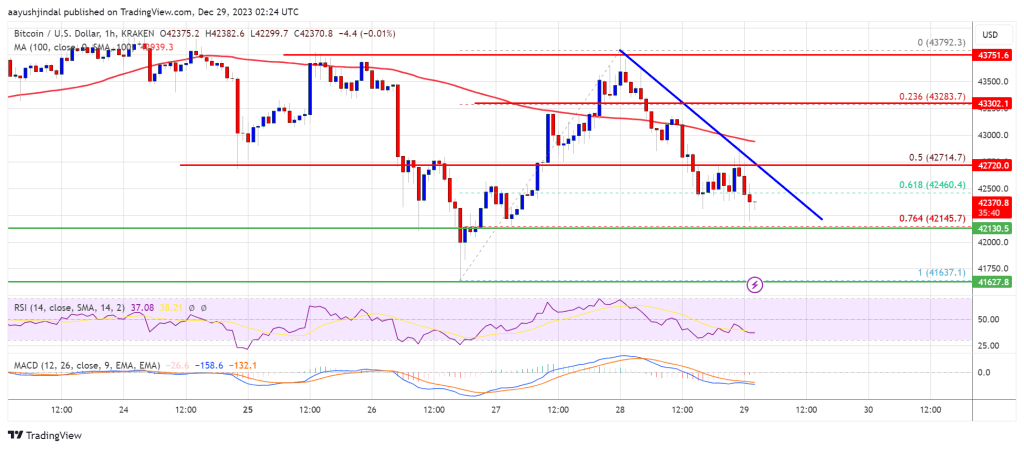
There is a key bearish trend line forming with resistance near $42,550 on the hourly chart of the BTC/USD pair (data feed from Kraken).
The pair could continue to decline if it stays below the $43,000 level.
Bitcoin price made a fresh attempt to gain pace above the $43,200 level. BTC climbed above the $43,500 level, but it struggled to reach the $44,000 resistance zone.
A high was formed near $43,792 and the price started a fresh decline. There was a clear inverted V pattern formed and the price declined below the $43,200 level. The bears were able to push the price below the 50% Fib retracement level of the upward move from the $41,637 swing low to the $43,792 low.
Bitcoin is now trading below $43,000 and the 100 hourly Simple moving average. It is also consolidating below the 61.8% Fib retracement level of the upward move from the $41,637 swing low to the $43,792 low.
On the upside, immediate resistance is near the $42,500 level. There is also a key bearish trend line forming with resistance near $42,550 on the hourly chart of the BTC/USD pair. The first major resistance is $43,000. A close above the $43,000 level could send the price further higher.
Source: BTCUSD on TradingView.com
The main hurdle sits at $43,250. A close above the $43,250 resistance could start a decent move toward the $43,800 level. The next key resistance could be near $44,000, above which BTC could rise toward the $45,000 level.
If Bitcoin fails to rise above the $43,000 resistance zone, it could continue to move down. Immediate support on the downside is near the $42,150 level.
The next major support is near $41,650. If there is a move below $41,650, there is a risk of more losses. In the stated case, the price could drop toward the $40,500 support in the near term.
Technical indicators:
Hourly MACD – The MACD is now gaining pace in the bearish zone.
Hourly RSI (Relative Strength Index) – The RSI for BTC/USD is now below the 50 level.
Major Support Levels – $42,150, followed by $41,650.
Major Resistance Levels – $42,550, $43,000, and $43,800.
[#item_full_content]NewsBTCRead MoreCoinDesk analysis finds 10 unusually large trading days in 2026, raising questions about how investors…
Bitcoin Magazine Bitcoin Life Insurer Meanwhile Raises $37.5M as Wealthy Families Look to Pass On…
Bitcoin Magazine Here’s How Not To Screw up Your Bitcoin Privacy Just one transaction can…
Bitcoin Magazine Bitcoin ETFs Shed $729M in Two Days as Investors Reverse Course U.S. investors…
Bitcoin Magazine Calamos Investments CEO John Koudounis: Bitcoin Will Hit $1M by 2030 Is Bitcoin…
Bitcoin Magazine Building the Berkshire Hathaway of Bitcoin | Twenty One Capital CEO Rapha Zagury…