Bitcoin price stayed above the $57,650 support zone. BTC is now rising and might aim for a move above the $60,000 resistance zone.
Bitcoin started a recovery wave above the $58,500 resistance zone.
The price is trading below $60,000 and the 100 hourly Simple moving average.
There is a connecting bearish trend line forming with resistance at $60,000 on the hourly chart of the BTC/USD pair (data feed from Kraken).
The pair might attempt a fresh increase if it settles above the $60,000 resistance zone.
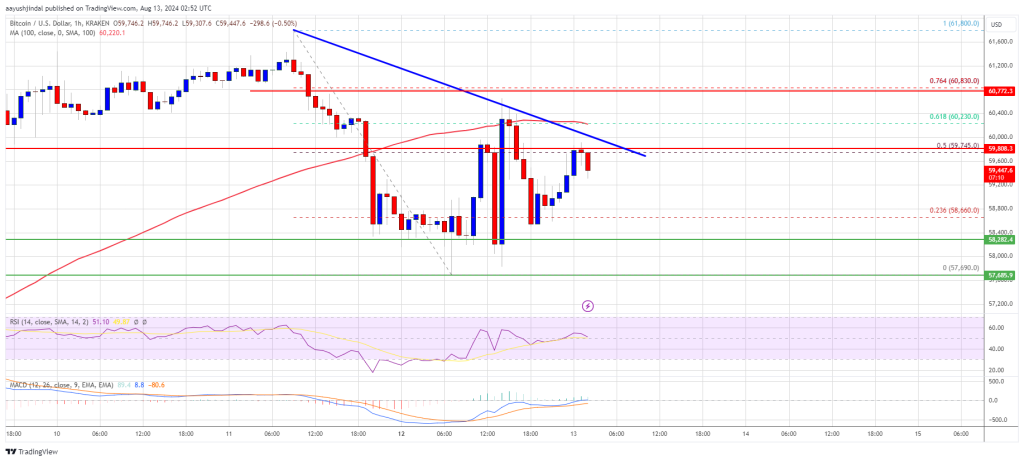
Bitcoin price started a downside correction below the $60,000 level. BTC declined below the $59,500 and $58,000 levels to move into a short-term bearish zone. A low was formed at $57,690 and the price recently started a recovery wave.
There was a move above the $58,000 and $58,500 levels. The price climbed above the 50% Fib retracement level of the downward move from the $61,800 swing high to the $57,690 swing low.
Bitcoin price is now trading below $60,000 and the 100 hourly Simple moving average. On the upside, the price could face resistance near the $60,000 level. There is also a connecting bearish trend line forming with resistance at $60,000 on the hourly chart of the BTC/USD pair.
The first key resistance is near the $60,250 level. It is close to the 61.8% Fib retracement level of the downward move from the $61,800 swing high to the $57,690 swing low. A clear move above the $60,250 resistance might send the price further higher in the coming sessions. The next key resistance could be $61,200.
The next major hurdle sits at $62,500. A close above the $62,500 resistance might spark more upsides. In the stated case, the price could rise and test the $64,200 resistance.
If Bitcoin fails to rise above the $60,000 resistance zone, it could start another decline. Immediate support on the downside is near the $58,800 level.
The first major support is $57,650. The next support is now near the $57,000 zone. Any more losses might send the price toward the $55,500 support zone or even $55,000 in the near term.
Technical indicators:
Hourly MACD – The MACD is now gaining pace in the bullish zone.
Hourly RSI (Relative Strength Index) – The RSI for BTC/USD is now above the 50 level.
Major Support Levels – $58,500, followed by $57,650.
Major Resistance Levels – $60,000, and $60,250.
[#item_full_content]NewsBTCRead MoreBearish traders lost $281 million in liquidations over 24 hours, nearly double the longs, as…
For readers tracking where the market is actually changing, this is the part that matters.…
The headline number is useful, but the real story is what it says about positioning.…
Bitcoin Magazine Bitcoin Exchange Inflows Spike to 49,000 BTC in a Day, Signaling More Volatility…
Bitcoin Magazine Wavespace Launches MiCA-Compliant Self-Custodial Bitcoin Debit Card Powered by Lightning and NWC Wavespace,…
For readers tracking where the market is actually changing, this is the part that matters.…