Bitcoin price is holding gains above the $69,200 zone. BTC could gain bullish momentum if it clears the $70,800 and $71,250 resistance levels.
Bitcoin is attempting another increase above the $70,000 zone.
The price is trading above $70,000 and the 100 hourly Simple moving average.
There is a connecting bearish trend line forming with resistance at $70,800 on the hourly chart of the BTC/USD pair (data feed from Kraken).
The pair could gain bullish momentum if it clears the $71,250 resistance zone.
Bitcoin price attempted more gains above the $70,500 level. However, BTC struggled to gain pace for a move above the $71,200 and $71,400 levels.
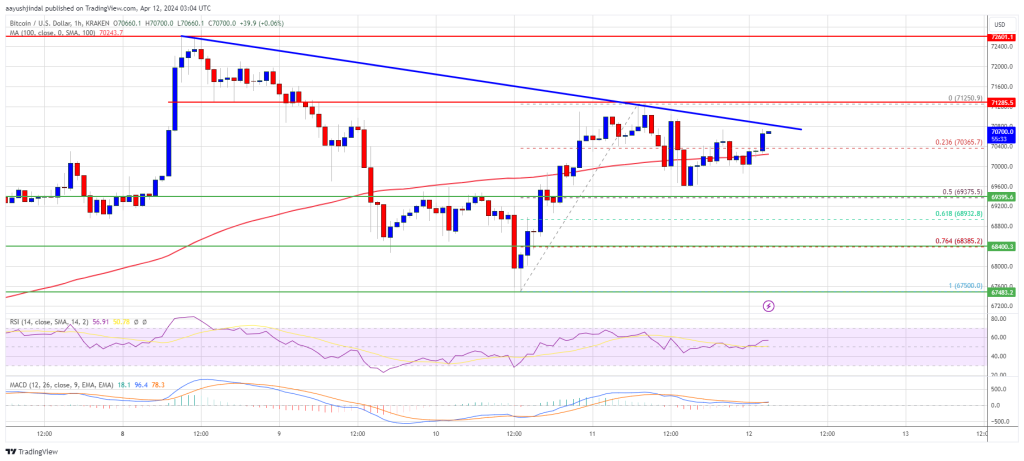
A high was formed at $71,250 before there was a downside correction. There was a move below the $70,500 level. The price dipped below the 23.6% Fib retracement level of the upward move from the $67,500 swing low to the $71,250 high.
However, the bulls are active above the $69,200 level. It is close to the 50% Fib retracement level of the upward move from the $67,500 swing low to the $71,250 high.
Bitcoin is now trading above $70,000 and the 100 hourly Simple moving average. Immediate resistance is near the $70,800 level. There is also a connecting bearish trend line forming with resistance at $70,800 on the hourly chart of the BTC/USD pair.
Source: BTCUSD on TradingView.com
The first major resistance could be $71,250. The next resistance now sits at $71,400. If there is a clear move above the $71,400 resistance zone, the price could continue to move up. In the stated case, the price could rise toward $72,600. The next major resistance is near the $73,500 zone. Any more gains might send Bitcoin toward the $75,000 resistance zone in the near term.
If Bitcoin fails to rise above the $71,250 resistance zone, it could start another decline. Immediate support on the downside is near the $70,400 level and the 100 hourly SMA.
The first major support is $69,350. If there is a close below $69,350, the price could start a drop toward the $68,500 level. Any more losses might send the price toward the $67,500 support zone in the near term.
Technical indicators:
Hourly MACD – The MACD is now gaining pace in the bullish zone.
Hourly RSI (Relative Strength Index) – The RSI for BTC/USD is now above the 50 level.
Major Support Levels – $70,400, followed by $69,350.
Major Resistance Levels – $70,800, $71,250, and $72,600.
[#item_full_content]NewsBTCRead MoreThe Bitcoin price topped slightly above $126,000 back in October 2026 and is now down…
On-chain data shows the Bitcoin Whale Transaction Count has witnessed a drawdown recently, a sign…
Key indicators such as ETF inflows cloud the bullish $70,000 holdout storyRead MoreCoinDesk: Bitcoin, Ethereum,…
The Royal Government of Bhutan transferred 519.707 BTC on Wednesday, the latest in a series…
Bitcoin price started a recovery wave above $70,000. BTC is now consolidating above $70,200 and…
Bitcoin remains locked in a tight range, leaving traders uncertain about its next major move.…