Bitcoin price climbed above the $66,000 resistance zone and started consolidation. BTC is now eyeing the next move above the $67,200 resistance zone.
Bitcoin is eyeing a decent increase above the $67,200 resistance zone.
The price is trading above $65,500 and the 100 hourly Simple moving average.
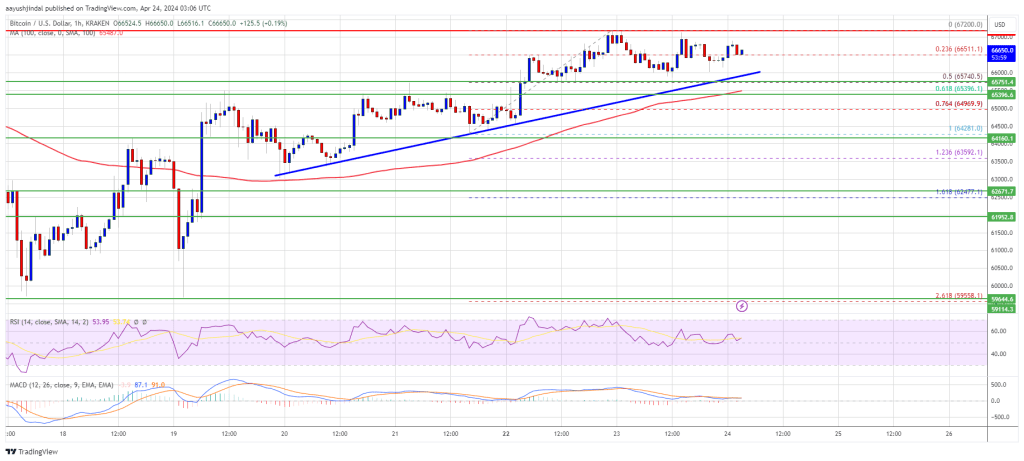
There is a connecting bullish trend line forming with support at $65,900 on the hourly chart of the BTC/USD pair (data feed from Kraken).
The pair could gain bullish momentum if it clears the $67,200 resistance zone.
Bitcoin price started a fresh increase above the $65,500 and $66,000 resistance levels. BTC even climbed above the $67,000 level. It traded as high as $67,200 and is currently consolidating gains.
There was a minor decline below the $66,500 level, but the price remained stable above the 23.6% Fib retracement level of the upward move from the $64,280 swing low to the $67,200 low. Bitcoin price is still trading above $65,500 and the 100 hourly Simple moving average.
There is also a connecting bullish trend line forming with support at $65,900 on the hourly chart of the BTC/USD pair. The trend line is near the 50% Fib retracement level of the upward move from the $64,280 swing low to the $67,200 low.
Immediate resistance is near the $67,000 level. The first major resistance could be $67,200. A clear move above the $67,200 resistance might send the price higher. The next resistance now sits at $68,500. If there is a clear move above the $68,500 resistance zone, the price could continue to move up. In the stated case, the price could rise toward $70,000.
Source: BTCUSD on TradingView.com
The next major resistance is near the $70,500 zone. Any more gains might send Bitcoin toward the $72,000 resistance zone in the near term.
If Bitcoin fails to rise above the $67,000 resistance zone, it could start a downside correction. Immediate support on the downside is near the $66,200 level.
The first major support is $66,000 or the trend line. If there is a close below $66,000, the price could start to drop toward $65,400. Any more losses might send the price toward the $64,200 support zone in the near term.
Technical indicators:
Hourly MACD – The MACD is now losing pace in the bullish zone.
Hourly RSI (Relative Strength Index) – The RSI for BTC/USD is now above the 50 level.
Major Support Levels – $66,200, followed by $66,000.
Major Resistance Levels – $67,000, $67,200, and $68,500.
[#item_full_content]NewsBTCRead MoreTL;DR U.S. spot Bitcoin ETFs recorded $324.6 million in net inflows on September 18. Fidelity’s…
"Bitcoin feels like the CD in the age of Spotify, the DVD in the age…
Bitcoin Magazine Bitcoin Community Recognizes Quantum Computing Risk: VanEck Quantum computing is a risk to…
Bitcoin Magazine Bitcoin Price Surges Over $81,000 Despite Clarity Act Fail and Interest Rate Hike…
Bitcoin Magazine The Next 3-5 Years of Bitcoin Lending SALT Lending CRO Hunter Albright says…
Bitcoin is down just 1.5% in its historically weakest month and remains on track for…