Bitcoin price is holding gains above the $57,500 resistance. BTC is now showing positive signs and might aim for a move toward $60,000.
Bitcoin is attempting a fresh increase above the $57,200 support zone.
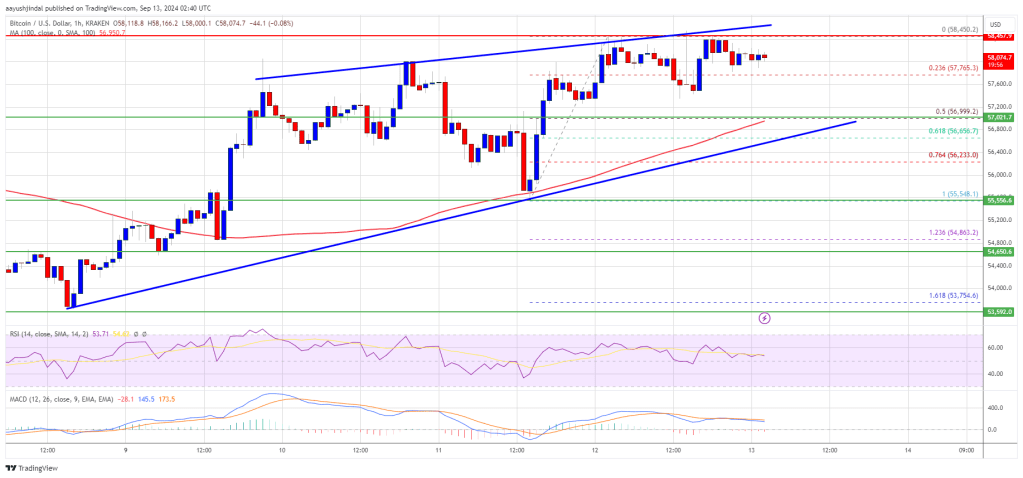
The price is trading above $57,500 and the 100 hourly Simple moving average.
There is a key contracting triangle forming with resistance at $58,500 on the hourly chart of the BTC/USD pair (data feed from Kraken).
The pair could climb higher if it clears the $58,500 and $58,650 resistance levels in the near term.
Bitcoin price started a decent increase after it broke the $57,000 resistance zone. BTC was able to climb above the $57,500 resistance. The pair even cleared the $58,000 resistance zone.
However, the bears seem to be active near the $58,500 resistance zone. A high is formed at $58,450 and the price is now consolidating gains. There was a minor decline below the $58,000 level. The price even dipped below the 23.6% Fib retracement level of the upward move from the $55,550 swing low to the $58,450 high.
Bitcoin is now trading above $57,500 and the 100 hourly Simple moving average. On the upside, the price could face resistance near the $58,500 level. There is also a key contracting triangle forming with resistance at $58,500 on the hourly chart of the BTC/USD pair.
The first key resistance is near the $58,650 level. A clear move above the $58,650 resistance might start a steady increase in the coming sessions. The next key resistance could be $59,200. A close above the $59,200 resistance might spark more upsides. In the stated case, the price could rise and test the $60,000 resistance.
If Bitcoin fails to rise above the $58,500 resistance zone, it could start another decline. Immediate support on the downside is near the $57,600 level.
The first major support is $56,650 or the 61.8% Fib retracement level of the upward move from the $55,550 swing low to the $58,450 high. The next support is now near the $56,220 zone. Any more losses might send the price toward the $55,550 support in the near term.
Technical indicators:
Hourly MACD – The MACD is now losing pace in the bullish zone.
Hourly RSI (Relative Strength Index) – The RSI for BTC/USD is now above the 50 level.
Major Support Levels – $57,600, followed by $55,550.
Major Resistance Levels – $58,500, and $58,650.
[#item_full_content]NewsBTCRead MoreAn attacker fed the lending system a fake, abnormally low bitcoin price, liquidated vaults that…
A two-day chip rebound stalled ahead of Alphabet's earnings in a sign of whether the…
Semiconductor stocks led a second day of gains on AI optimism, while the yen slid…
Bitcoin Magazine Bitcoin Maxi Jack Dorsey Unveils New Open Source Group Chat App Tech entrepreneur…
Bitcoin Magazine Bitcoin is NOT Changed by Proof Of Node You might have heard about…
BTC has rebounded 15% from the July lows, but some analysts cautioned that the next…