Bitcoin price dipped a few points against the US Dollar after the fed rate hike. BTC remained supported and might eye a fresh increase above the $20,500 resistance.
Bitcoin corrected further lower and tested the $20,000 support zone.
The price is trading below $20,500 and the 100 hourly simple moving average.
There is a major bearish trend line forming with resistance near $20,520 on the hourly chart of the BTC/USD pair (data feed from Kraken).
The pair could a fresh increase if it clears the 100 hourly SMA and $20,500.
Bitcoin price struggled to gain pace for a move above the $20,650 resistance. BTC reacted to the downside and traded below the $20,400 level after the fed rate hike of 0.75 bps.
The price declined below the $20,250 support level and traded close to the $20,000 level. A low was formed near $20,059 and the price is now correcting losses. There was a move above the $20,250 level. The price climbed above the 23.6% Fib retracement level of the recent decline from the $20,864 swing high to $20,059 low.
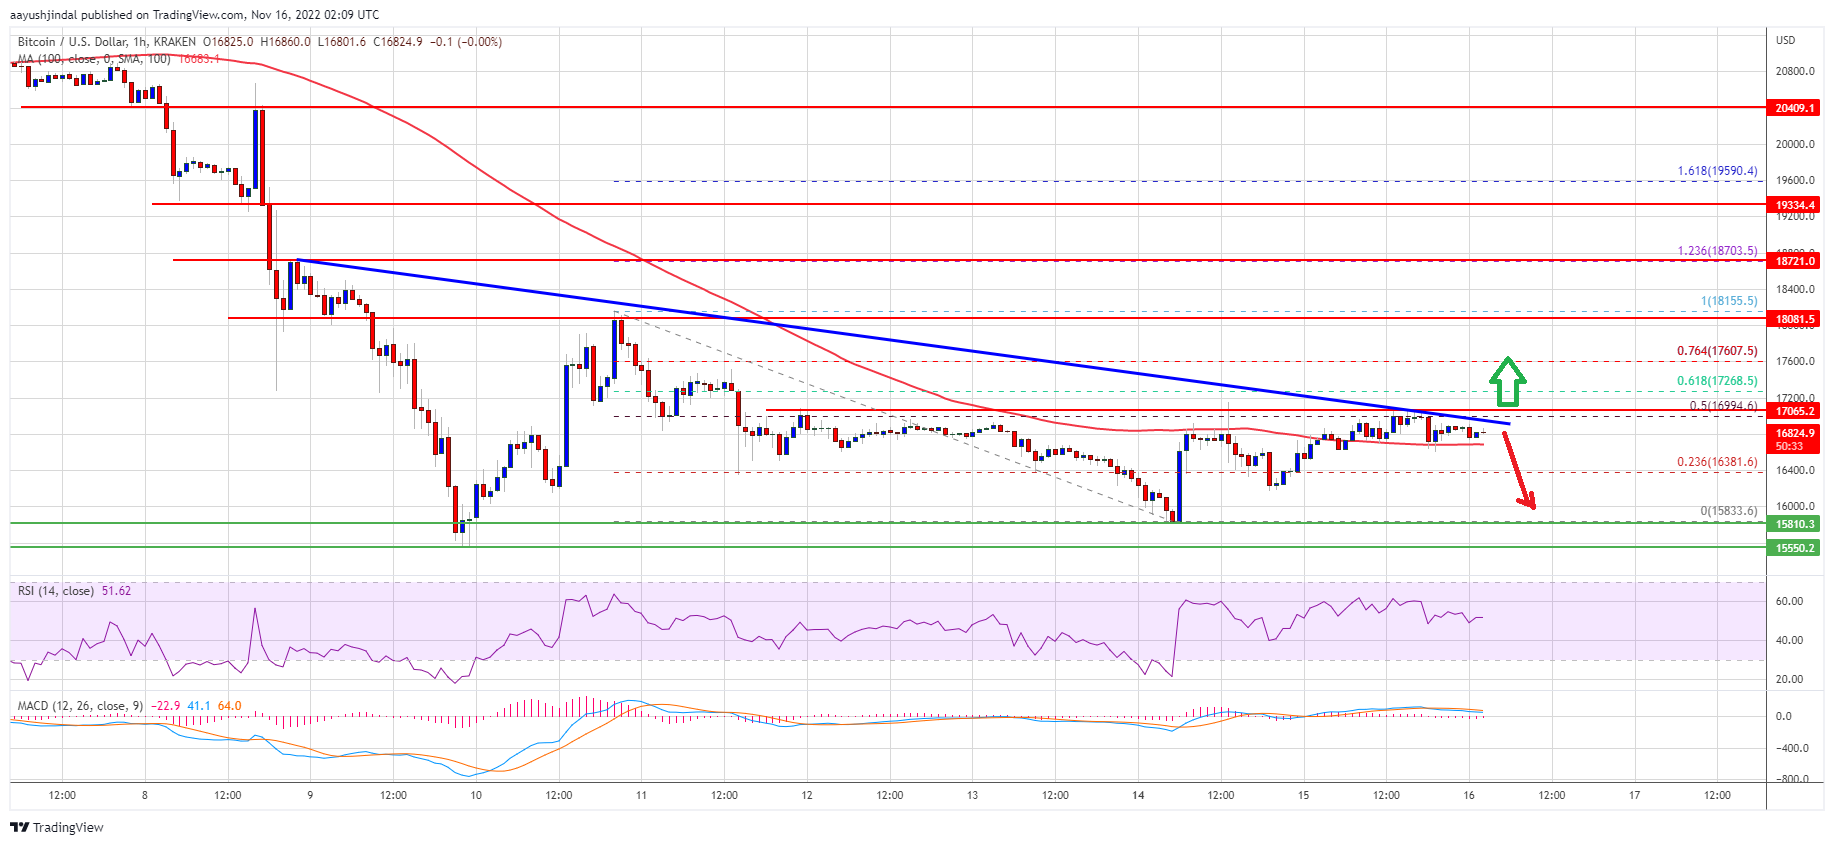
Bitcoin price is now trading below $20,500 and the 100 hourly simple moving average. There is also a major bearish trend line forming with resistance near $20,520 on the hourly chart of the BTC/USD pair.
On the upside, an immediate resistance is near the $20,370 level. The first major resistance sits near the $20,450 level. It is near the 50% Fib retracement level of the recent decline from the $20,864 swing high to $20,059 low. The main hurdle is near the trend line, $20,500, and the 100 hourly simple moving average.
Source: BTCUSD on TradingView.com
A clear move above the $20,500 zone could send the price further higher. The next major resistance is still near $21,000, above which the price may perhaps start a steady increase.
If bitcoin fails to clear above the $20,500 resistance zone, it could resume its decline. An immediate support on the downside is near the $20,200 zone.
The next major support is near the $20,050 zone. The main support is now near $20,000, below which there is a risk of a sharp decline. In this case, the price may perhaps decline towards the $19,200 level.
Technical indicators:
Hourly MACD – The MACD is now gaining pace in the bullish zone.
Hourly RSI (Relative Strength Index) – The RSI for BTC/USD is now near the 50 level.
Major Support Levels – $20,200, followed by $20,000.
Major Resistance Levels – $20,370, $20,450 and $20,500.
Bitcoin price dipped a few points against the US Dollar after the fed rate hike. BTC remained supported and might eye a fresh increase above the $20,500 resistance.
Bitcoin corrected further lower and tested the $20,000 support zone.
The price is trading below $20,500 and the 100 hourly simple moving average.
There is a major bearish trend line forming with resistance near $20,520 on the hourly chart of the BTC/USD pair (data feed from Kraken).
The pair could a fresh increase if it clears the 100 hourly SMA and $20,500.
Bitcoin price struggled to gain pace for a move above the $20,650 resistance. BTC reacted to the downside and traded below the $20,400 level after the fed rate hike of 0.75 bps.
The price declined below the $20,250 support level and traded close to the $20,000 level. A low was formed near $20,059 and the price is now correcting losses. There was a move above the $20,250 level. The price climbed above the 23.6% Fib retracement level of the recent decline from the $20,864 swing high to $20,059 low.
Bitcoin price is now trading below $20,500 and the 100 hourly simple moving average. There is also a major bearish trend line forming with resistance near $20,520 on the hourly chart of the BTC/USD pair.
On the upside, an immediate resistance is near the $20,370 level. The first major resistance sits near the $20,450 level. It is near the 50% Fib retracement level of the recent decline from the $20,864 swing high to $20,059 low. The main hurdle is near the trend line, $20,500, and the 100 hourly simple moving average.
Source: BTCUSD on TradingView.com
A clear move above the $20,500 zone could send the price further higher. The next major resistance is still near $21,000, above which the price may perhaps start a steady increase.
If bitcoin fails to clear above the $20,500 resistance zone, it could resume its decline. An immediate support on the downside is near the $20,200 zone.
The next major support is near the $20,050 zone. The main support is now near $20,000, below which there is a risk of a sharp decline. In this case, the price may perhaps decline towards the $19,200 level.
Technical indicators:
Hourly MACD – The MACD is now gaining pace in the bullish zone.
Hourly RSI (Relative Strength Index) – The RSI for BTC/USD is now near the 50 level.
Major Support Levels – $20,200, followed by $20,000.
Major Resistance Levels – $20,370, $20,450 and $20,500.
Tags: bitcoinbtcusdBTCUSDTxbtusd
NewsBTCRead More
Japanese mandate sparks surge in equities and safe havens.Read MoreCoinDesk: Bitcoin, Ethereum, Crypto News and…
The Financial Times and Peter Schiff were among the no-coiners giving themselves pats on the…
The Polymarket bet is a reminder that the weirdest corners of crypto are sometimes the…
Bitcoin Magazine Bitcoin Price Reclaims $71,000 as Institutions Buy the Dip and Retail Interest Surges…
Bitcoin Magazine Bithumb Bitcoin Blunder Sends $44 Billion to Users, Rattles Crypto Markets South Korean…
Recent on-chain data shows that the Bitcoin price is currently at an important phase, raising…