Bitcoin price extended losses and tested the $65,500 support zone. BTC is now consolidating and might aim for a fresh increase if it clears $66,500.
Bitcoin tested the $65,500 level and is attempting a recovery wave.
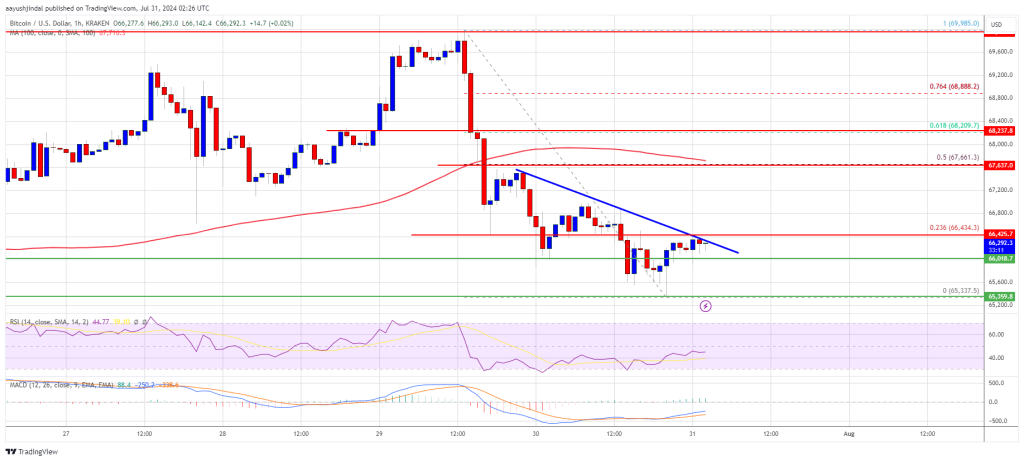
The price is trading below $68,000 and the 100 hourly Simple moving average.
There is a connecting bearish trend line forming with resistance at $66,400 on the hourly chart of the BTC/USD pair (data feed from Kraken).
The pair might start a fresh increase if it clears the $66,500 resistance zone.
Bitcoin price extended losses below the $66,500 support zone. BTC even spiked below the $66,000 and $65,500 levels. A low is formed near $65,337 and the price is now consolidating losses.
It recovered above the $66,000 level and tested the 23.6% Fib retracement level of the downward move from the $69,985 swing high to the $65,337 low. However, the price is now struggling to clear the $66,500 resistance zone. There is also a connecting bearish trend line forming with resistance at $66,400 on the hourly chart of the BTC/USD pair.
Bitcoin price is trading below $68,000 and the 100 hourly Simple moving average. On the upside, the price could face resistance near the $66,400 level. The first key resistance is near the $66,500 level.
A clear move above the $66,500 resistance might send the price further higher in the coming sessions. The next key resistance could be $67,650 or the 50% Fib retracement level of the downward move from the $69,985 swing high to the $65,337 low.
The next major hurdle sits at $68,200. A close above the $68,200 resistance might spark bullish moves. In the stated case, the price could rise and test the $70,000 resistance.
If Bitcoin fails to recover above the $66,500 resistance zone, it could start another decline. Immediate support on the downside is near the $66,000 level.
The first major support is $65,350. The next support is now near $65,000. Any more losses might send the price toward the $63,500 support zone in the near term.
Technical indicators:
Hourly MACD – The MACD is now losing pace in the bearish zone.
Hourly RSI (Relative Strength Index) – The RSI for BTC/USD is now below the 50 level.
Major Support Levels – $66,000, followed by $65,350.
Major Resistance Levels – $66,500, and $67,650.
[#item_full_content]NewsBTCRead MoreBitcoin price corrected gains and tested the $67,500 support. BTC is now recovering and might…
Bitcoin’s recent price decline has led to many traders betting on further downside, with on-chain…
Bitcoin Magazine Bitcoin Bears Dominate: Failure to Break $71,800 Keeps Downside Risk Alive Bitcoin Price…
Bitcoin Magazine Metaplanet Reports $619 Million Loss as Bitcoin Holdings Take Hit Tokyo-based Bitcoin treasury…
Bitcoin Magazine Trump Family-Backed American Bitcoin Keeps Stacking Bitcoin, Holdings Pass 6,000 BTC Trump family-backed…
Bitcoin Magazine Payjoin Foundation Gains 501(c)(3) Status, Enabling Tax-Deductible Donations for Bitcoin Privacy Development The…