Bitcoin price is consolidating near the $57,500 zone. BTC could gain bullish momentum if it clears the $58,000 resistance zone in the near term.
Bitcoin started a recovery wave above the $55,500 and $56,500 levels.
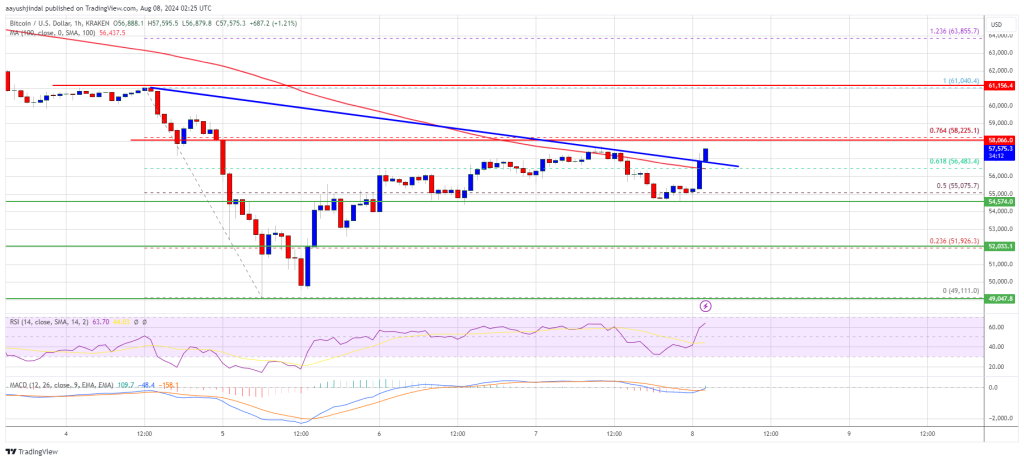
The price is trading above $57,000 and the 100 hourly Simple moving average.
There was a break above a key bearish trend line with resistance at $56,850 on the hourly chart of the BTC/USD pair (data feed from Kraken).
The pair might struggle to clear the $58,250 resistance zone.
Bitcoin price started a recovery wave above the $53,500 resistance zone. BTC was able to clear the $55,500 and $56,500 resistance levels to move into a short-term positive zone.
There was a move above the 61.8% Fib retracement level of the key drop from the $61,040 swing high to the $49,110 swing low. Besides, there was a break above a key bearish trend line with resistance at $56,850 on the hourly chart of the BTC/USD pair.
The bulls are now attempting more upsides above $57,500. Bitcoin price is now trading above $57,000 and the 100 hourly Simple moving average. On the upside, the price could face resistance near the $58,250 level. It is close to the 76.4% Fib retracement level of the key drop from the $61,040 swing high to the $49,110 swing low.
The first key resistance is near the $58,800 level. A clear move above the $58,800 resistance might send the price further higher in the coming sessions. The next key resistance could be $59,500. The next major hurdle sits at $60,000. A close above the $60,000 resistance might spark bullish moves. In the stated case, the price could rise and test the $62,000 resistance.
If Bitcoin fails to recover above the $58,250 resistance zone, it could start another decline. Immediate support on the downside is near the $56,400 level and the 100 hourly SMA.
The first major support is $54,500. The next support is now near $53,500. Any more losses might send the price toward the $52,000 support zone in the near term.
Technical indicators:
Hourly MACD – The MACD is now gaining pace in the bullish zone.
Hourly RSI (Relative Strength Index) – The RSI for BTC/USD is now above the 50 level.
Major Support Levels – $56,400, followed by $54,500.
Major Resistance Levels – $58,250, and $58,800.
[#item_full_content]NewsBTCRead MoreUnofficial economic indicators suggest the Fed may need to ease policy, boosting riskier assets.Read MoreCoinDesk:…
Michael Saylor reinforces commitment to bitcoin and quantum security on Q4 earnings call.Read MoreCoinDesk: Bitcoin,…
The Bitcoin price is currently trading under immense bearish pressure, and the downtrend might not…
What to Know: Renewed US-Iran tensions and upcoming nuclear talks are creating a ‘risk-off’ environment,…
What to Know: Marathon Digital moved $87M in $BTC to exchanges, signaling potential sell pressure…
What to Know: Bitcoin executed a ‘whipsaw’ recovery, reclaiming $65K after volatility in the Asian…