Bitcoin price started a fresh increase above $92,000. BTC is now showing bullish signs but might struggle to clear the $95,000 resistance zone.
Bitcoin started a fresh increase above the $92,200 zone.
The price is trading above $92,500 and the 100 hourly Simple moving average.
There is a key bullish trend line forming with support at $92,650 on the hourly chart of the BTC/USD pair (data feed from Kraken).
The pair might continue to move up if it stays above the $92,000 zone.
Bitcoin price remained supported above the $91,200 zone and started a fresh increase. BTC gained pace for a move above the $92,000 and $92,200 resistance levels.
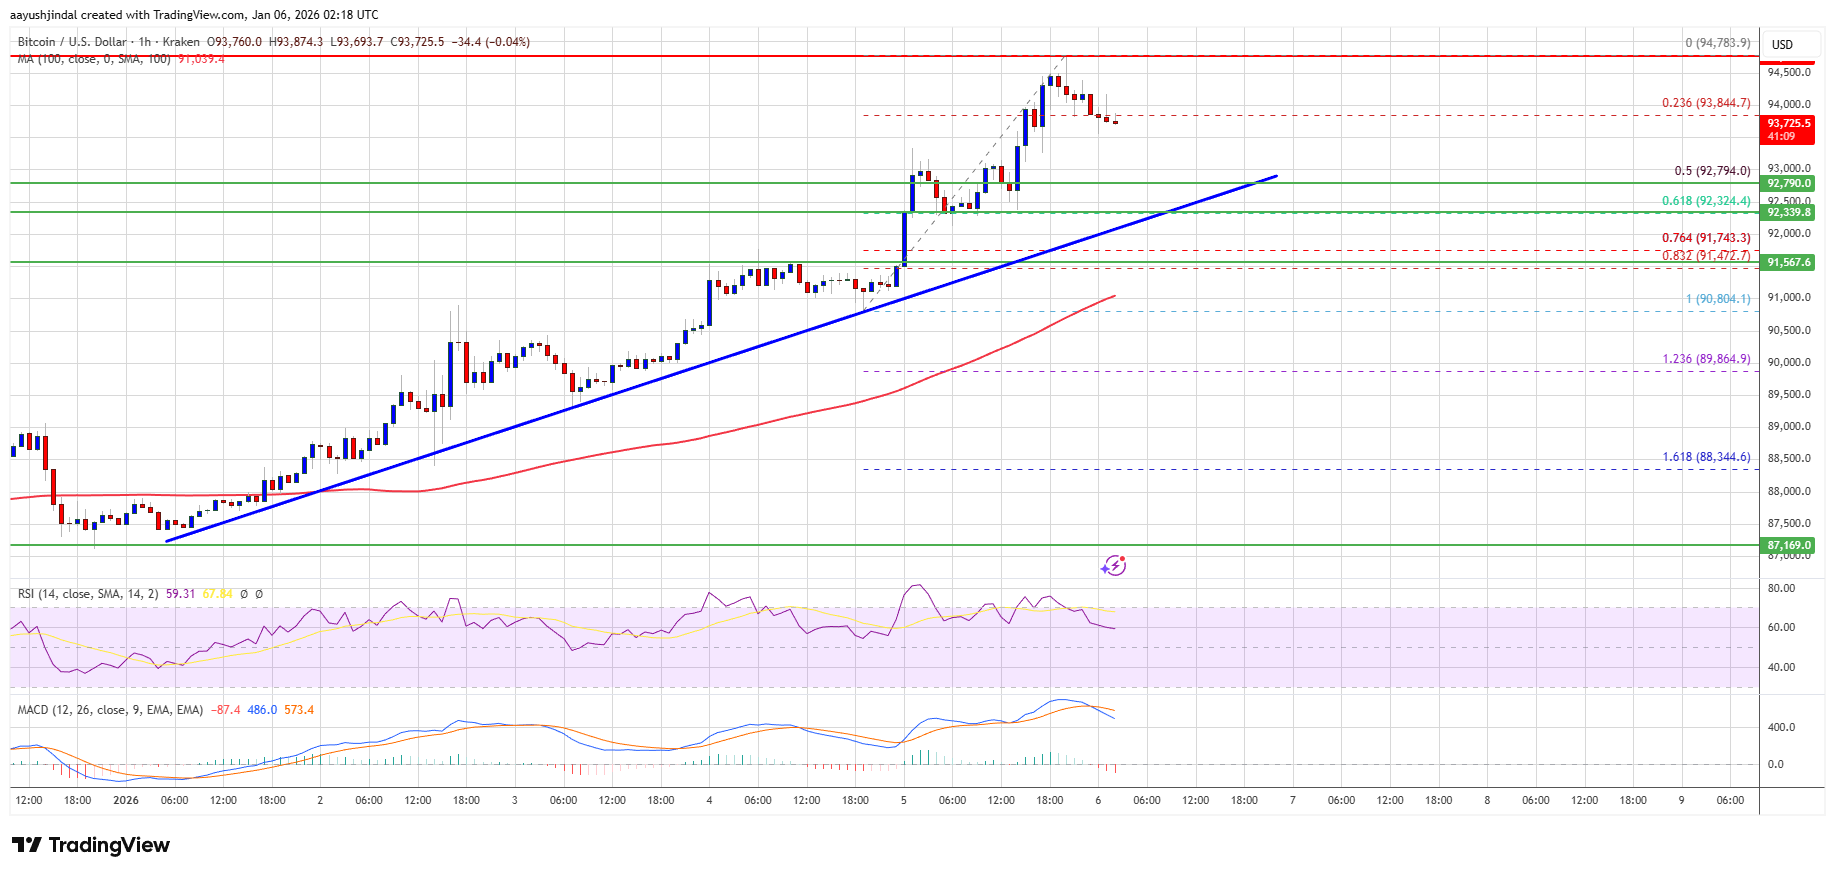
It even surpassed $94,000. A new multi-week high was formed at $94,783 and the price is now consolidating gains. There was a minor decline below the 23.6% Fib retracement level of the recent upward move from the $90,805 swing low to the $94,783 high.
Bitcoin is now trading above $92,500 and the 100 hourly Simple moving average. Besides, there is a key bullish trend line forming with support at $92,650 on the hourly chart of the BTC/USD pair.
If the price remains stable above $92,500, it could attempt a fresh increase. Immediate resistance is near the $94,200 level. The first key resistance is near the $94,500 level. The next resistance could be $95,000. A close above the $95,000 resistance might send the price further higher.
In the stated case, the price could rise and test the $95,800 resistance. Any more gains might send the price toward the $96,500 level. The next barrier for the bulls could be $97,000 and $97,200.
If Bitcoin fails to rise above the $94,500 resistance zone, it could start another decline. Immediate support is near the $93,200 level. The first major support is near the $92,800 level or the 50% Fib retracement level of the recent upward move from the $90,805 swing low to the $94,783 high.
The next support is now near the $92,500 zone. Any more losses might send the price toward the $91,200 support in the near term. The main support sits at $90,000, below which BTC might accelerate lower in the near term.
Technical indicators:
Hourly MACD – The MACD is now losing pace in the bullish zone.
Hourly RSI (Relative Strength Index) – The RSI for BTC/USD is now above the 50 level.
Major Support Levels – $92,800, followed by $92,500.
Major Resistance Levels – $94,500 and $95,000.
[#item_full_content]NewsBTCRead MoreThe Polymarket bet is a reminder that the weirdest corners of crypto are sometimes the…
Bitcoin Magazine Bitcoin Price Reclaims $71,000 as Institutions Buy the Dip and Retail Interest Surges…
Bitcoin Magazine Bithumb Bitcoin Blunder Sends $44 Billion to Users, Rattles Crypto Markets South Korean…
Recent on-chain data shows that the Bitcoin price is currently at an important phase, raising…
Since reaching its current all-time-high price of $126,000 in October last year, the Bitcoin market…
Bitcoin is navigating one of its deepest conviction zones yet, a phase that tests nerves…