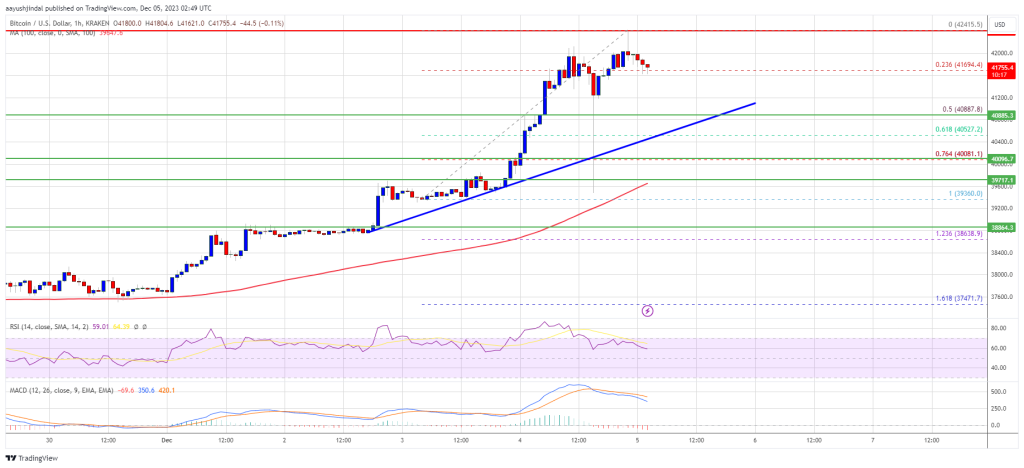
Bitcoin price extended its rally above the $42,000 resistance. BTC is now correcting gains and might test the $40,800 support zone.
Bitcoin surged further above the $41,200 and $42,000 levels.
The price is trading above $41,200 and the 100 hourly Simple moving average.
There is a major bullish trend line forming with support near $40,880 on the hourly chart of the BTC/USD pair (data feed from Kraken).
The pair could correct lower toward $40,800 before it starts a fresh increase.
Bitcoin price started a strong increase above the $38,500 resistance zone. BTC gained over 10% in the past few sessions and broke many hurdles near $40,000.
It even cleared the $41,200 resistance and spiked above the $42,000 zone. A new multi-month high is formed near $42,415 and the price is now correcting gains. There was a move below the $42,000 level. The price is now testing the 23.6% Fib retracement level of the upward move from the $39,360 swing low to the $42,415 high.
Bitcoin also trades above $41,200 and the 100 hourly Simple moving average. Besides, there is a major bullish trend line forming with support near $40,880 on the hourly chart of the BTC/USD pair. The trend line is close to the 50% Fib retracement level of the upward move from the $39,360 swing low to the $42,415 high.
On the upside, immediate resistance is near the $42,200 level. The first major resistance is forming near $42,500, above which the price might rise toward the $43,200 level.
Source: BTCUSD on TradingView.com
A close above the $43,200 resistance might send the price further higher. The next key resistance could be near $44,000, above which BTC could rise toward the $45,000 level.
If Bitcoin fails to rise above the $42,200 resistance zone, it could start a downside correction. Immediate support on the downside is near the $41,200 level.
The next major support is near $40,800 and the trend line. If there is a move below $40,800, there is a risk of more downsides. In the stated case, the price could drop toward the $40,000 support in the near term.
Technical indicators:
Hourly MACD – The MACD is now losing pace in the bullish zone.
Hourly RSI (Relative Strength Index) – The RSI for BTC/USD is now above the 50 level.
Major Support Levels – $41,200, followed by $40,800.
Major Resistance Levels – $42,200, $42,500, and $43,200.
[#item_full_content]NewsBTCRead MoreBoth Mubadala Investment Company and Al Warda Investments lifted investments in BlackRock's iShares Bitcoin ETF…
Bitcoin Magazine Coinbase CEO Brian Armstrong Addresses “Paper Bitcoin” Claims, Claims Bitcoin ETFs Are Fully…
Bitcoin Magazine Abu Dhabi’s Mubadala Boosts Bitcoin ETF Holdings to $630 Million Abu Dhabi’s sovereign…
The most important indicator for bitcoin's price direction at the moment is the iShares Tech-Software…
Some reacted with concerns about dilution for existing shareholders due to the stock price decline…
Bitcoin Magazine Abu Dhabi’s Al Warda Raises Bitcoin ETF Stake to 8.2 Million IBIT Shares…