Bitcoin price extended its increase and climbed above the $66,000 resistance zone. BTC is now showing positive signs and might find bids near $65,500.
Bitcoin gained pace for a move above the $65,500 resistance zone.
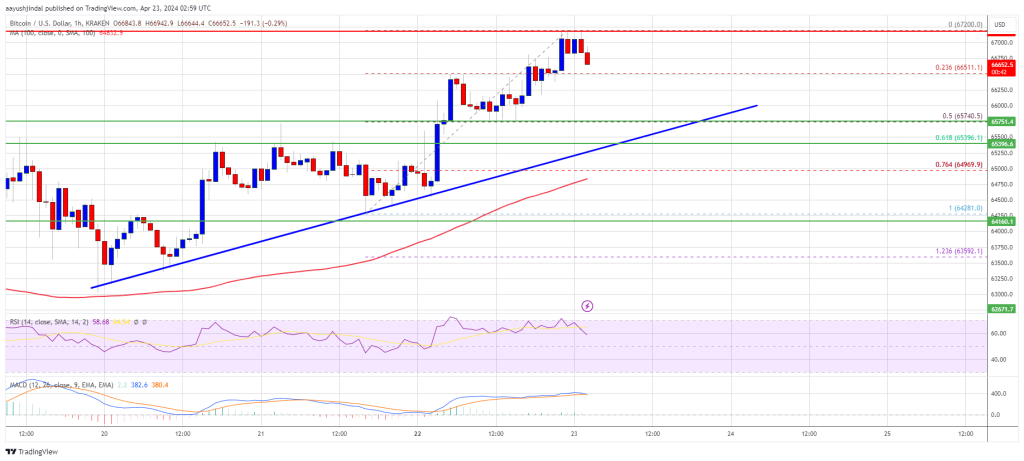
The price is trading above $65,500 and the 100 hourly Simple moving average.
There is a key bullish trend line forming with support at $65,700 on the hourly chart of the BTC/USD pair (data feed from Kraken).
The pair could correct lower, but the bulls might remain active near the $65,500 support.
Bitcoin price started a fresh increase above the $64,500 and $65,000 resistance levels. BTC bulls even pushed the price above the $66,000 resistance. It traded to a new weekly high at $67,200 and is currently consolidating gains.
The price is slowly moving lower toward the 23.6% Fib retracement level of the upward move from the $64,281 swing low to the $67,200 low. Bitcoin price is still trading above $65,500 and the 100 hourly Simple moving average.
There is also a key bullish trend line forming with support at $65,700 on the hourly chart of the BTC/USD pair. The trend line is near the 50% Fib retracement level of the upward move from the $64,281 swing low to the $67,200 low.
Immediate resistance is near the $67,000 level. The first major resistance could be $67,200. The next resistance now sits at $68,500. If there is a clear move above the $68,500 resistance zone, the price could continue to move up. In the stated case, the price could rise toward $70,000.
Source: BTCUSD on TradingView.com
The next major resistance is near the $70,500 zone. Any more gains might send Bitcoin toward the $72,000 resistance zone in the near term.
If Bitcoin fails to rise above the $67,000 resistance zone, it could start a downside correction. Immediate support on the downside is near the $66,500 level.
The first major support is $65,700 or the trend line. If there is a close below $65,500, the price could start to drop toward $65,000. Any more losses might send the price toward the $64,200 support zone in the near term.
Technical indicators:
Hourly MACD – The MACD is now losing pace in the bullish zone.
Hourly RSI (Relative Strength Index) – The RSI for BTC/USD is now above the 50 level.
Major Support Levels – $66,500, followed by $65,500.
Major Resistance Levels – $67,000, $67,200, and $68,500.
[#item_full_content]NewsBTCRead MoreAnalyst Willy Woo has highlighted how some old-school Bitcoin on-chain models could suggest a bottoming…
Bitcoin Magazine U.S. Senators Unveil ‘Mined in America Act’ to Reshore BTC Mining, Codify Bitcoin…
The XRP price traded at around $1.30 on Monday as markets consolidated and Bitcoin (BTC)…
The new rollout converts BTC to dollars by default for small businesses, aiming to embed…
The Bitcoin price could be on the verge of a major surge as new discussions…
Satoshis per share climbs past 660, reinforcing rapid treasury expansion since Nasdaq debut.Read MoreCoinDesk: Bitcoin,…