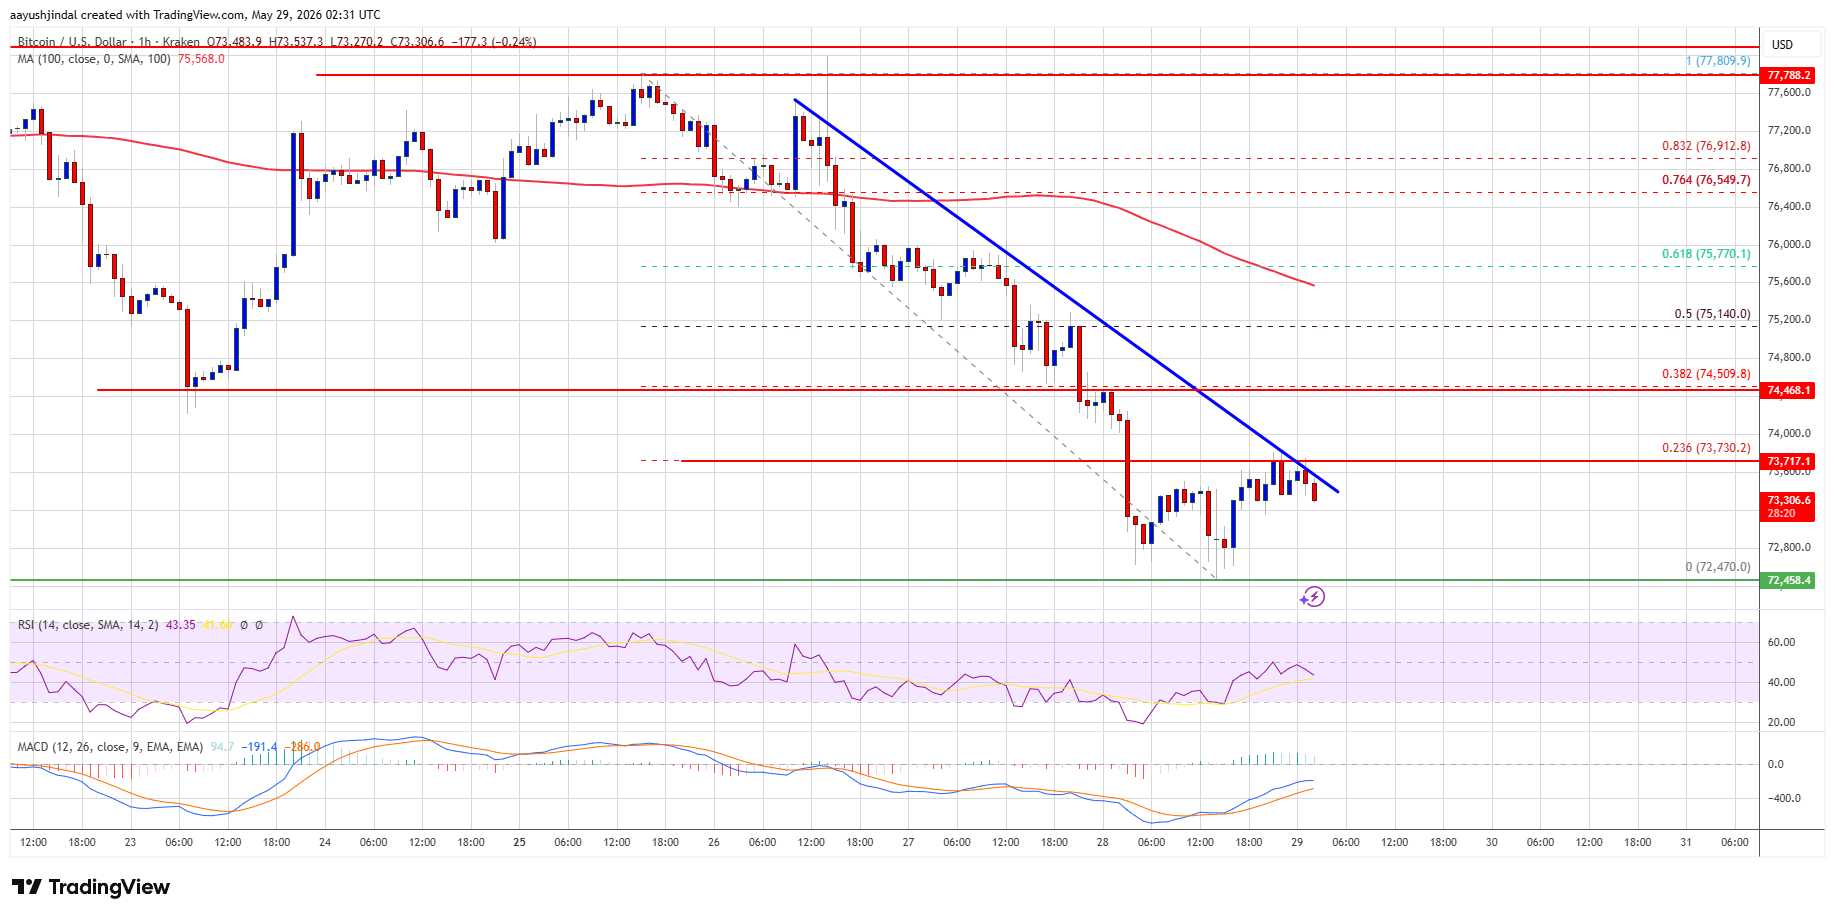
Bitcoin price started a fresh decline below the $74,000 zone. BTC is consolidating and might struggle to stay above the $72,000 support.
Bitcoin failed to stay above $75,000 and extended losses.
The price is trading below $74,000 and the 100 hourly simple moving average.
There is a bearish trend line forming with resistance at $73,750 on the hourly chart of the BTC/USD pair (data feed from Kraken).
The pair might extend losses if it stays below the $74,000 and $75,000 levels.
Bitcoin price failed to stay above the $75,500 support zone. BTC remained in a bearish zone and extended losses below the $75,000 level. There was a move below the $74,200 level.
The price even dipped below $73,000. A low was formed at $72,470 and the price is now consolidating losses. It is still struggling below the 23.6% Fib retracement level of the downward move from the $77,810 swing high to the $72,470 low.
Bitcoin is now trading below $74,000 and the 100 hourly simple moving average. If the price remains stable above $72,000, it could attempt a fresh increase. Immediate resistance is near the $73,800 level. There is also a bearish trend line forming with resistance at $73,750 on the hourly chart of the BTC/USD pair.
The first key resistance is near the $74,500 level. A close above the $74,500 resistance might send the price further higher. In the stated case, the price could rise and test the $75,150 resistance or the 50% Fib retracement level of the downward move from the $77,810 swing high to the $72,470 low. Any more gains might send the price toward the $75,500 level. The next barrier for the bulls could be $76,200.
If Bitcoin fails to rise above the $74,500 resistance zone, it could start another decline. Immediate support is near the $72,500 level.
The first major support is near the $72,000 level. The next support is now near the $71,200 zone. Any more losses might send the price toward the $70,500 support in the near term. The main support now sits at $70,000, below which BTC might struggle to recover in the near term.
Technical indicators:
Hourly MACD – The MACD is now gaining pace in the bearish zone.
Hourly RSI (Relative Strength Index) – The RSI for BTC/USD is now below the 50 level.
Major Support Levels – $72,500, followed by $72,000.
Major Resistance Levels – $73,750 and $74,500.
[#item_full_content]NewsBTCRead MoreTL;DR: BlackRock’s IBIT recorded roughly $665 million in net inflows on October 19, even as…
TL;DR: AnchorWatch has opened its Nevada-chartered Bitcoin custody service, pairing a choice of key-control structures…
TL;DR: Strive purchased another 1,223 Bitcoin over two days, taking its reported holdings to 36,818…
TL;DR: Super League shareholders have approved proposals connected to Metaplanet’s plan to contribute 2,100 BTC…
Bitcoin Magazine Kalshi Pushes Deeper Into Crypto Derivatives With Bitcoin-Backed Margin Loans Kalshi is doubling…
Bitcoin Magazine Beyond HODLing: How Bitcoin-Backed Loans Can Unlock New Financial Opportunities For long-term Bitcoin…