Bitcoin price is correcting gains and trading below $118,000. BTC is still showing some bearish signs and might decline toward the $112,000 zone.
Bitcoin started a downside correction below the $118,000 zone.
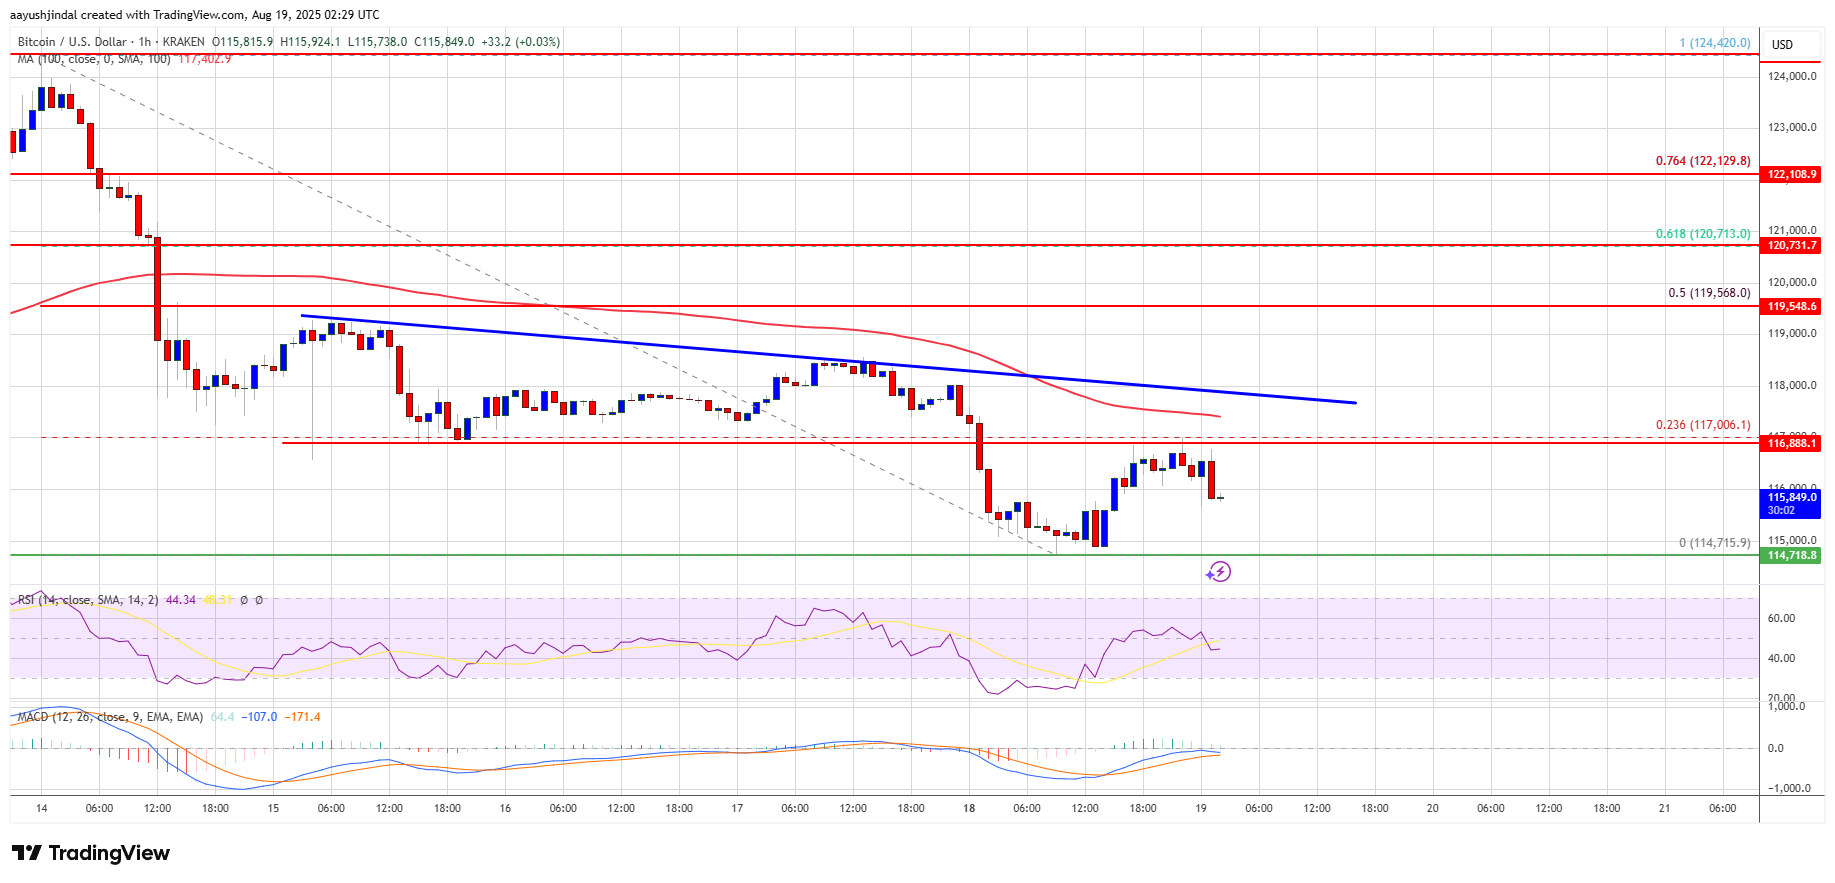
The price is trading below $116,500 and the 100 hourly Simple moving average.
There is a key bearish trend line forming with resistance at $118,000 on the hourly chart of the BTC/USD pair (data feed from Kraken).
The pair might start another increase if it clears the $118,000 resistance zone.
Bitcoin price started a fresh decline after a close below the $120,000 level. BTC gained bearish momentum and traded below the $118,500 support zone.
There was a move below the $116,500 support zone and the 100 hourly Simple moving average. The pair tested the $114,750 zone. A low was formed at $114,715 and the price is now consolidating below the 23.6% Fib retracement level of the recent decline from the $124,420 swing high to the $114,715 low.
Bitcoin is now trading below $117,000 and the 100 hourly Simple moving average. Immediate resistance on the upside is near the $117,000 level. The first key resistance is near the $118,000 level. There is also a key bearish trend line forming with resistance at $118,000 on the hourly chart of the BTC/USD pair.
The next resistance could be $118,500. A close above the $118,500 resistance might send the price further higher. In the stated case, the price could rise and test the $119,500 resistance level. It is close to the 50% Fib retracement level of the recent decline from the $124,420 swing high to the $114,715 low. Any more gains might send the price toward the $120,000 level. The main target could be $121,500.
If Bitcoin fails to rise above the $118,000 resistance zone, it could start a fresh decline. Immediate support is near the $115,000 level. The first major support is near the $114,750 level.
The next support is now near the $113,500 zone. Any more losses might send the price toward the $112,000 support in the near term. The main support sits at $110,000, below which BTC might continue to move down.
Technical indicators:
Hourly MACD – The MACD is now gaining pace in the bearish zone.
Hourly RSI (Relative Strength Index) – The RSI for BTC/USD is now below the 50 level.
Major Support Levels – $115,000, followed by $113,500.
Major Resistance Levels – $118,000 and $118,500.
[#item_full_content]NewsBTCRead MoreAccording to a new forecast from an Elliott Wave analyst, the Bitcoin price could be…
In a sign of the growing convergence between traditional finance and digital assets, Emirates NBD…
Crypto rebounds sharply from Tuesday's lows, yet traders question whether the move marks a lasting…
Bitcoin Magazine Morgan Stanley Has Future Plans for Bitcoin Trading, Lending, and Custody Morgan Stanley…
Peter Schiff has a number. And he wants everyone to see it. The longtime gold…
Cited in the 2008 Bitcoin white paper, Back argued volatility is typical even as regulatory…