Bitcoin price started a major increase above $68,000. BTC is now struggling to clear the $70,000 resistance and might correct some gains.
Bitcoin started a fresh increase after it settled above the $67,000 support.
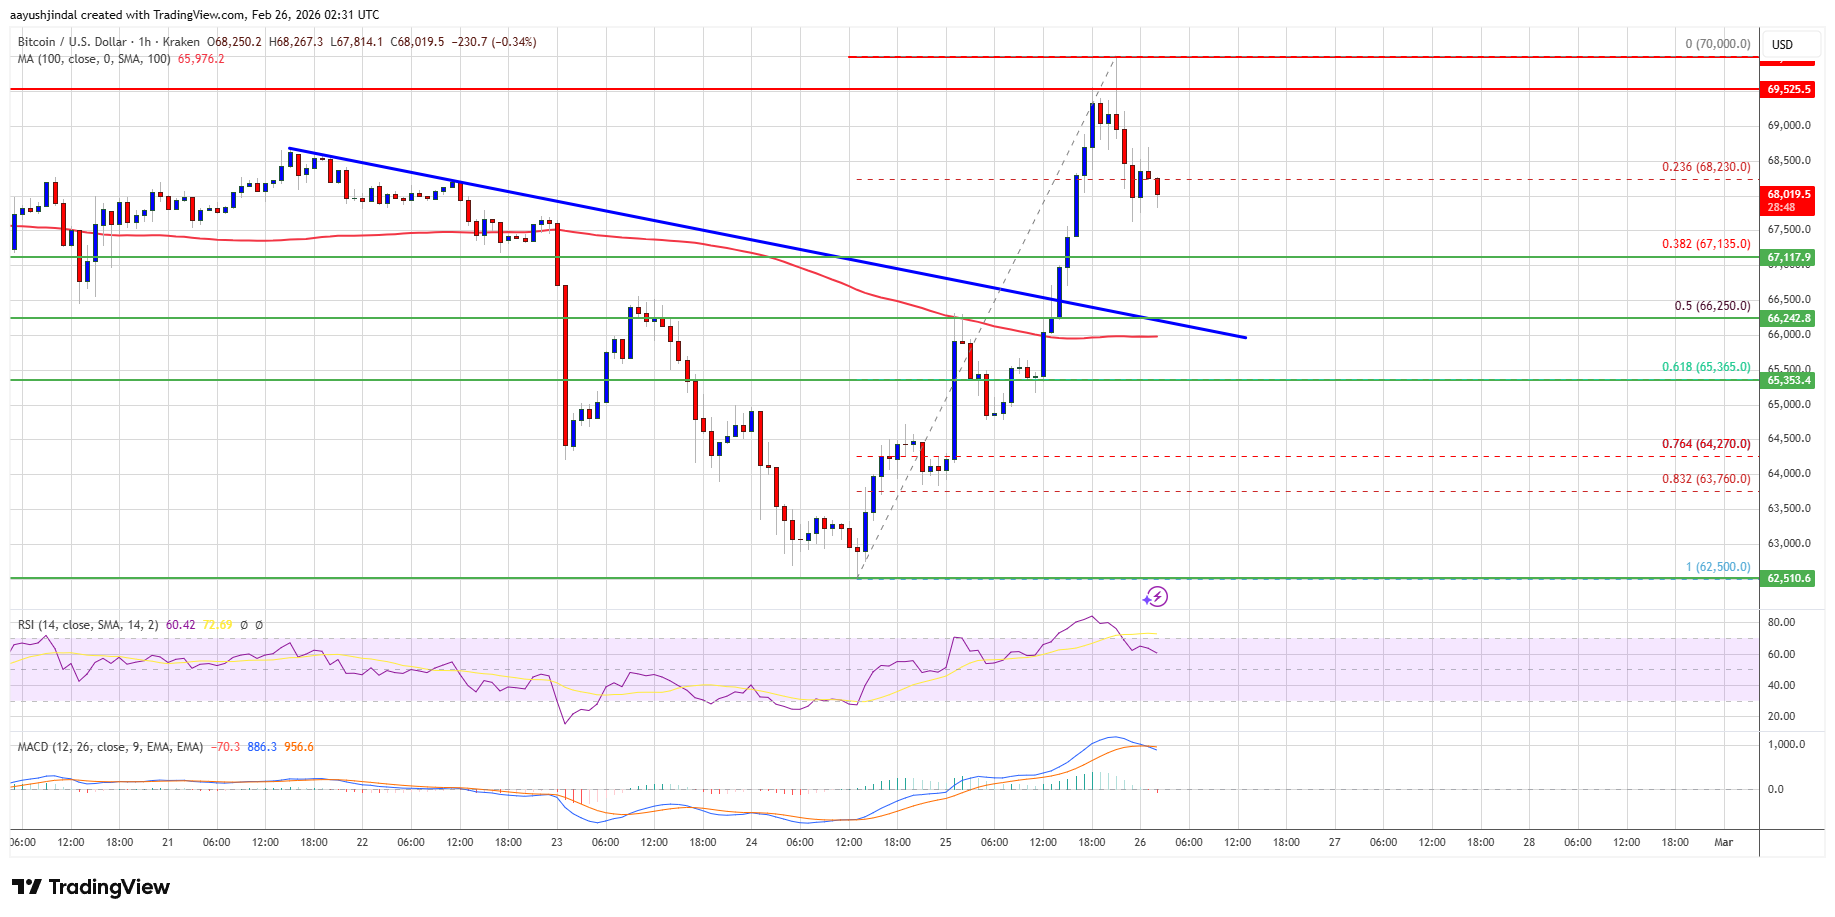
The price is trading above $67,500 and the 100 hourly simple moving average.
There was a break above a bearish trend line with resistance at $66,500 on the hourly chart of the BTC/USD pair (data feed from Kraken).
The pair might dip again if it trades below the $67,500 and $67,200 levels.
Bitcoin price managed to form a base above the $66,000 zone. BTC started a fresh increase and was able to surpass the $67,000 resistance zone.
The price even rallied above the $68,000 resistance. Finally, the bears appeared near $70,000. A high was formed at $70,000, and the price is now correcting gains below the 23.6% Fib retracement level of the upward move from the $62,500 swing low to the $70,000 high.
Bitcoin is now trading above $67,500 and the 100 hourly simple moving average. If the price remains stable above $67,500, it could attempt a fresh increase. Immediate resistance is near the $68,500 level.
The first key resistance is near the $69,200 level. A close above the $69,200 resistance might send the price further higher. In the stated case, the price could rise and test the $70,000 resistance. Any more gains might send the price toward the $71,200 level. The next barrier for the bulls could be $72,200 and $72,500.
If Bitcoin fails to rise above the $68,500 resistance zone, it could start another decline. Immediate support is near the $67,500 level. The first major support is near the $67,200 level or the 50% Fib retracement level of the upward move from the $62,500 swing low to the $70,000 high.
The next support is now near the $66,250 zone. Any more losses might send the price toward the $66,000 support in the near term. The main support now sits at $65,500, below which BTC might struggle to recover in the near term.
Technical indicators:
Hourly MACD – The MACD is now losing pace in the bullish zone.
Hourly RSI (Relative Strength Index) – The RSI for BTC/USD is now above the 50 level.
Major Support Levels – $67,500, followed by $67,200.
Major Resistance Levels – $68,500 and $69,200.
[#item_full_content]NewsBTCRead MoreAccording to a new forecast from an Elliott Wave analyst, the Bitcoin price could be…
In a sign of the growing convergence between traditional finance and digital assets, Emirates NBD…
Crypto rebounds sharply from Tuesday's lows, yet traders question whether the move marks a lasting…
Bitcoin Magazine Morgan Stanley Has Future Plans for Bitcoin Trading, Lending, and Custody Morgan Stanley…
Peter Schiff has a number. And he wants everyone to see it. The longtime gold…
Cited in the 2008 Bitcoin white paper, Back argued volatility is typical even as regulatory…