Bitcoin price failed to clear $90,000 and trimmed all gains. BTC is now consolidating losses and might struggle to stay above $86,500.
Bitcoin started a recovery wave but failed to surpass $90,000.
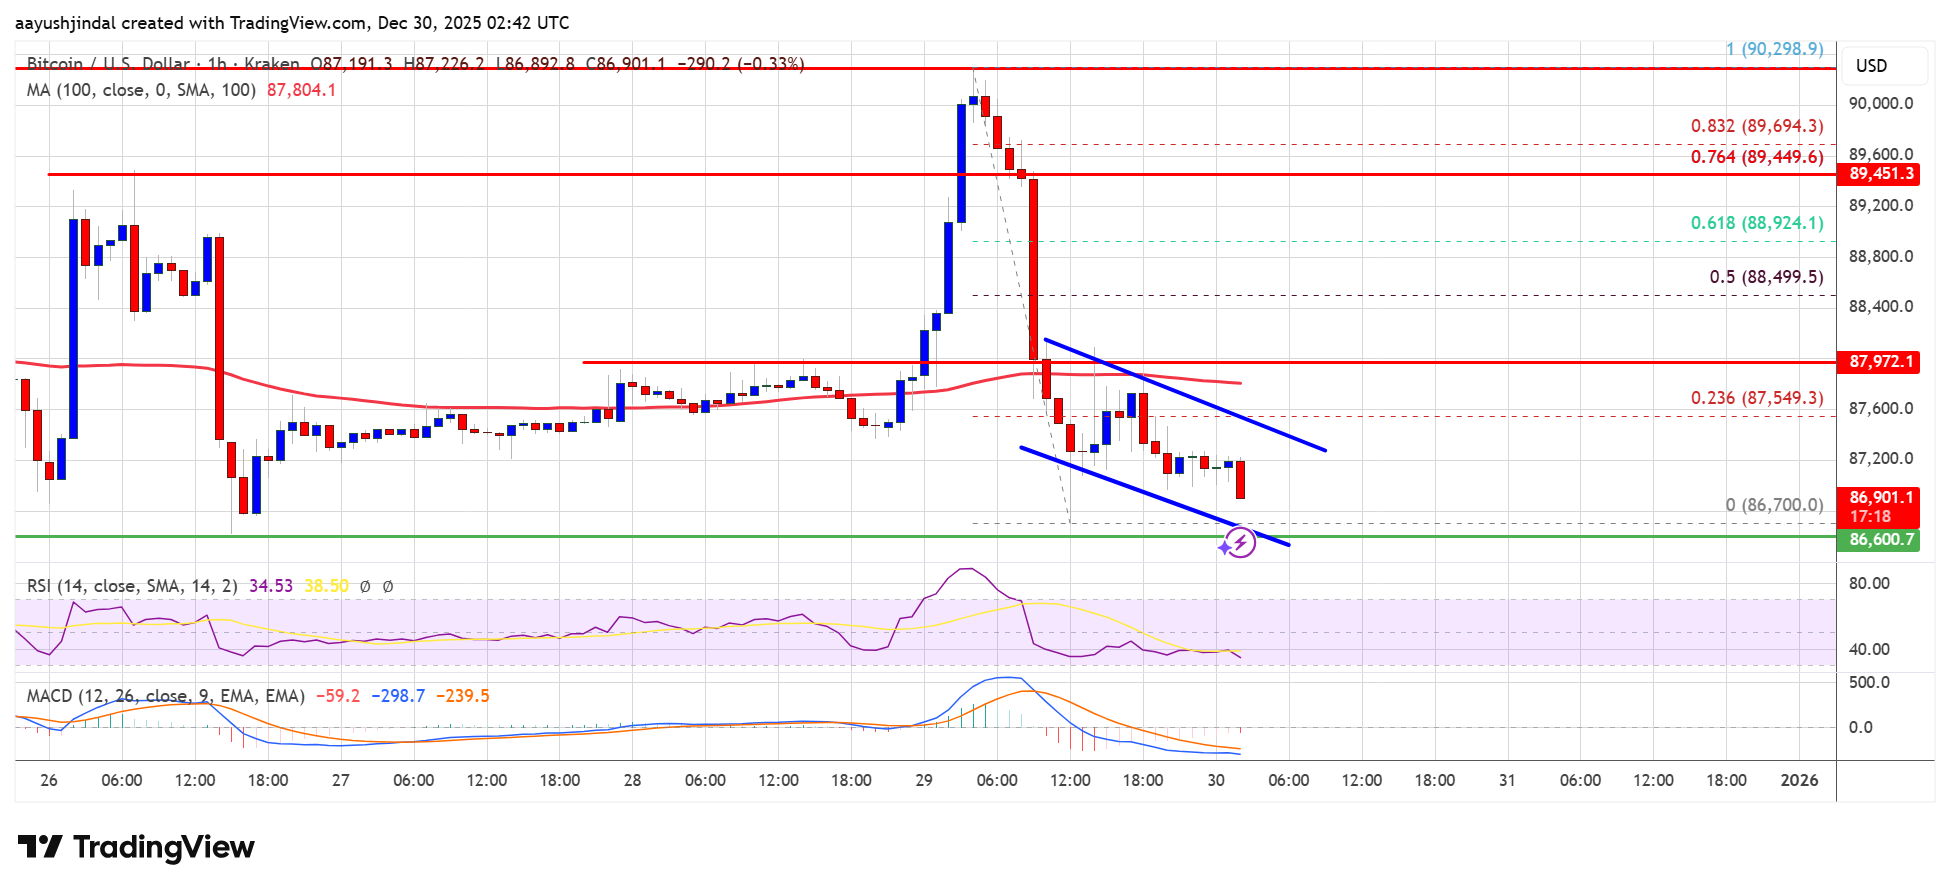
The price is trading below $88,000 and the 100 hourly Simple moving average.
There is a declining channel forming with resistance at $87,500 on the hourly chart of the BTC/USD pair (data feed from Kraken).
The pair might continue to move down if it trades below the $86,500 zone.
Bitcoin price attempted a fresh increase above $88,500 and started a recovery wave. BTC even climbed above the $89,000 barrier but struggled near $90,000.
A high was formed at $90,298 before the bears appeared. There was a sharp downside reaction below $89,000. BTC trimmed all gains and even dived below $88,000. A low was formed at $86,700, and the price is now consolidating losses below the 23.6% Fib retracement level of the downward move from the $90,298 swing high to the $86,700 low.
Bitcoin is now trading below $88,000 and the 100 hourly Simple moving average. If the price remains stable above $86,500, it could attempt a fresh recovery wave. Immediate resistance is near the $87,500 level. Besides, there is a declining channel forming with resistance at $87,500 on the hourly chart of the BTC/USD pair.
The first key resistance is near the $88,000 level. The next resistance could be $88,500 and the 50% Fib retracement level of the downward move from the $90,298 swing high to the $86,700 low.
A close above the $88,500 resistance might send the price further higher. In the stated case, the price could rise and test the $89,200 resistance. Any more gains might send the price toward the $90,000 level. The next barrier for the bulls could be $90,500 and $91,200.
If Bitcoin fails to rise above the $88,500 resistance zone, it could start another decline. Immediate support is near the $86,500 level. The first major support is near the $86,000 level.
The next support is now near the $85,500 zone. Any more losses might send the price toward the $85,000 support in the near term. The main support sits at $83,500, below which BTC might accelerate lower in the near term.
Technical indicators:
Hourly MACD – The MACD is now gaining pace in the bearish zone.
Hourly RSI (Relative Strength Index) – The RSI for BTC/USD is now below the 50 level.
Major Support Levels – $87,500, followed by $88,000.
Major Resistance Levels – $86,500 and $86,000.
[#item_full_content]NewsBTCRead MoreBitcoin traded around $69,800 as open interest rose to $102 billion, suggesting defensive, bearish bets…
Bitcoin (BTC) is currently navigating a trading range between $60,000 and $73,000, entering what analytics…
Tokyo-listed Metaplanet is expanding beyond holding BTC into funding, incubating, and granting to companies building…
The bridging protocol's team wants to exchange ACX tokens for equity in a new U.S.…
Brent crude surged 10% after attacks on two oil tankers in Iraqi waters, with the…
Bitcoin price failed to extend its recovery wave above the $70,500 zone. BTC is now…