Bitcoin price started a fresh decline and traded below $60,000. BTC is struggling and might continue to move down toward the $56,500 support.
Bitcoin gained bearish momentum below the $62,000 support level.
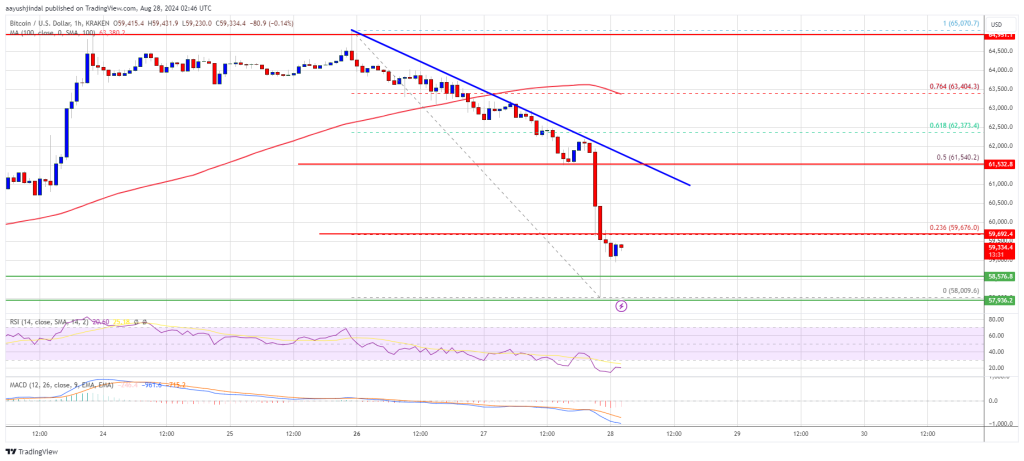
The price is trading below $62,000 and the 100 hourly Simple moving average.
There is a key bearish trend line forming with resistance at $61,500 on the hourly chart of the BTC/USD pair (data feed from Kraken).
The pair might slip further toward the $56,500 level before the bulls appear.
Bitcoin price failed to recover and extended losses below the $62,500 level. The bears took over and pushed the price below the $61,200 level. The price even dived below the $60,000 level.
A low was formed at $58,009 and the price is now consolidating losses. There was a minor recovery wave above the $58,500 and $59,000 levels. The price traded close to the 23.6% Fib retracement level of the downward move from the $65,070 swing high to the $58,009 low.
Bitcoin is now trading below $61,500 and the 100 hourly Simple moving average. On the upside, the price could face resistance near the $59,800 level. The first key resistance is near the $60,000 level. A clear move above the $60,000 resistance might send the price further higher in the coming sessions.
The next key resistance could be $61,500. There is also a key bearish trend line forming with resistance at $61,500 on the hourly chart of the BTC/USD pair. It is close to the 50% Fib retracement level of the downward move from the $65,070 swing high to the $58,009 low. A close above the $61,500 resistance might spark more upsides. In the stated case, the price could rise and test the $62,500 resistance.
If Bitcoin fails to rise above the $60,000 resistance zone, it could continue to move down. Immediate support on the downside is near the $58,500 level.
The first major support is $58,000. The next support is now near the $57,650 zone. Any more losses might send the price toward the $56,500 support in the near term.
Technical indicators:
Hourly MACD – The MACD is now gaining pace in the bearish zone.
Hourly RSI (Relative Strength Index) – The RSI for BTC/USD is now below the 50 level.
Major Support Levels – $58,500, followed by $58,000.
Major Resistance Levels – $60,000, and $61,500.
[#item_full_content]NewsBTCRead MoreEarnings disappointments weigh on AI related tech, while crypto sentiment improves on bitcoin’s rebound.Read MoreCoinDesk:…
Bitcoin’s role in big-money talks has shifted in recent weeks. Reports say analysts at JPMorgan…
What to Know: Metaplanet’s aggressive Bitcoin accumulation strategy confirms a growing trend of corporate treasury…
Bitcoin is on course to see five red months in a row, as it is…
Unofficial economic indicators suggest the Fed may need to ease policy, boosting riskier assets.Read MoreCoinDesk:…
Michael Saylor reinforces commitment to bitcoin and quantum security on Q4 earnings call.Read MoreCoinDesk: Bitcoin,…