Bitcoin price corrected gains and traded below the $88,000 support zone. BTC is now consolidating and might struggle to clear the $88,500 zone.
Bitcoin started a fresh decline from the $90,500 zone.
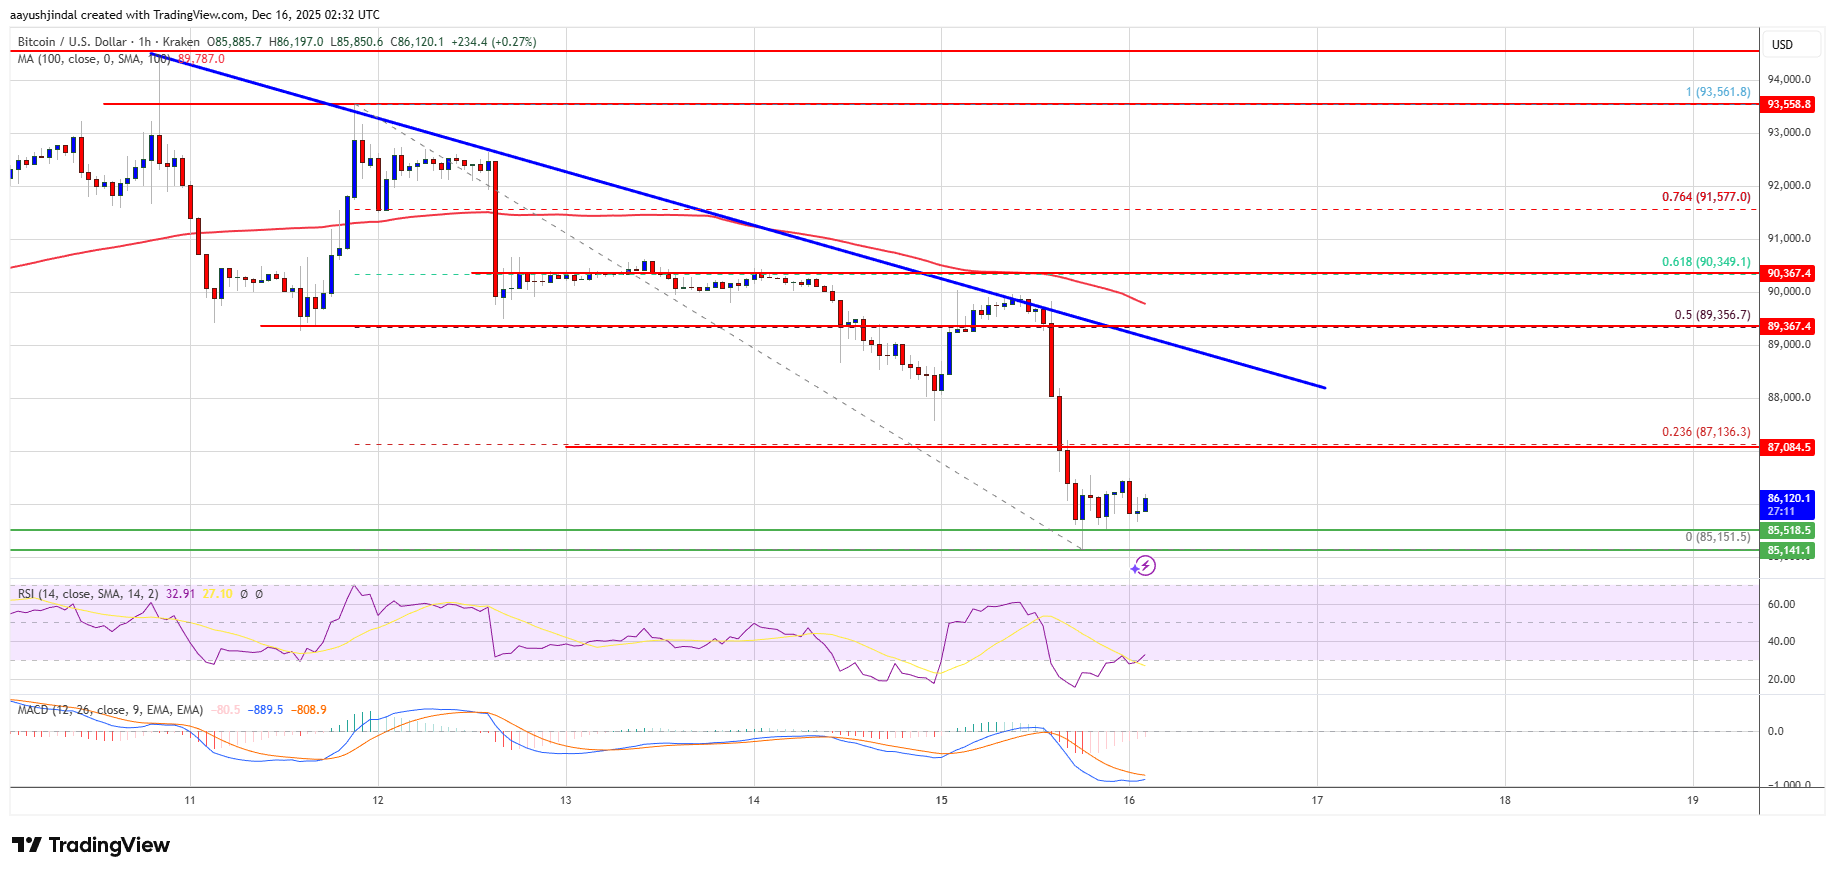
The price is trading below $88,000 and the 100 hourly Simple moving average.
There is a bearish trend line forming with resistance at $89,000 on the hourly chart of the BTC/USD pair (data feed from Kraken).
The pair might continue to move up if it settles above the $85,000 zone.
Bitcoin price failed to gain strength for a move above the $90,000 and $90,500 levels. BTC started a fresh decline and traded below the $88,500 support.
The price even spiked below the $87,000 support. However, the bulls were active near the $85,000 zone. A low was formed at $85,151 and the price is consolidating gains below the 23.6% Fib retracement level of the downward move from the $93,560 swing high to the $85,151 low.
Bitcoin is now trading below $88,000 and the 100 hourly Simple moving average. If the bulls remain in action, the price could attempt another increase. Immediate resistance is near the $87,150 level. The first key resistance is near the $87,500 level.
The next resistance could be $88,000. A close above the $88,000 resistance might send the price further higher. In the stated case, the price could rise and test the $89,000 resistance. There is also a bearish trend line forming with resistance at $89,000 on the hourly chart of the BTC/USD pair. Any more gains might send the price toward the $90,000 level. The next barrier for the bulls could be $91,000 and $91,500.
If Bitcoin fails to rise above the $87,000 resistance zone, it could start another decline. Immediate support is near the $85,500 level. The first major support is near the $85,000 level.
The next support is now near the $83,500 zone. Any more losses might send the price toward the $82,500 support in the near term. The main support sits at $80,000, below which BTC might accelerate lower in the near term.
Technical indicators:
Hourly MACD – The MACD is now losing pace in the bearish zone.
Hourly RSI (Relative Strength Index) – The RSI for BTC/USD is now below the 50 level.
Major Support Levels – $85,500, followed by $85,000.
Major Resistance Levels – $88,000 and $89,000.
[#item_full_content]NewsBTCRead MoreDespite a recent resurgence in prices, Bitcoin (BTC) and Ethereum (ETH), the two largest cryptocurrencies…
Bitcoin price started a strong increase and traded above the $75,500 zone. BTC is now…
A single on-chain indicator has quietly called every major Bitcoin cycle bottom for the past…
Strategy has once again strengthened its aggressive digital asset vault, adding another billion-dollar allocation of…
Bitcoin Magazine Jack Mallers Confirmed As A Bitcoin 2026 Speaker Jack Mallers has been officially…
Bitcoin Magazine From $5 to $75,000: Bitcoin’s Saint Patrick’s Day Prices Shows You the Wild…