Bitcoin price failed to clear $18,000 and started a fresh decline. BTC is showing bearish signs and it might soon decline towards the $15,000 level.
Bitcoin started a fresh decline from the $18,000 and $18,150 resistance levels.
The price is trading below $18,000 and the 100 hourly simple moving average.
There is a key bearish trend line forming with resistance near $16,600 on the hourly chart of the BTC/USD pair (data feed from Kraken).
The pair could resume its decline below the $15,500 support zone in the near term.
Bitcoin price attempted a recovery wave above the $17,500 resistance zone. However, BTC failed to gain strength above the $18,000 resistance and stayed below the 100 hourly simple moving average.
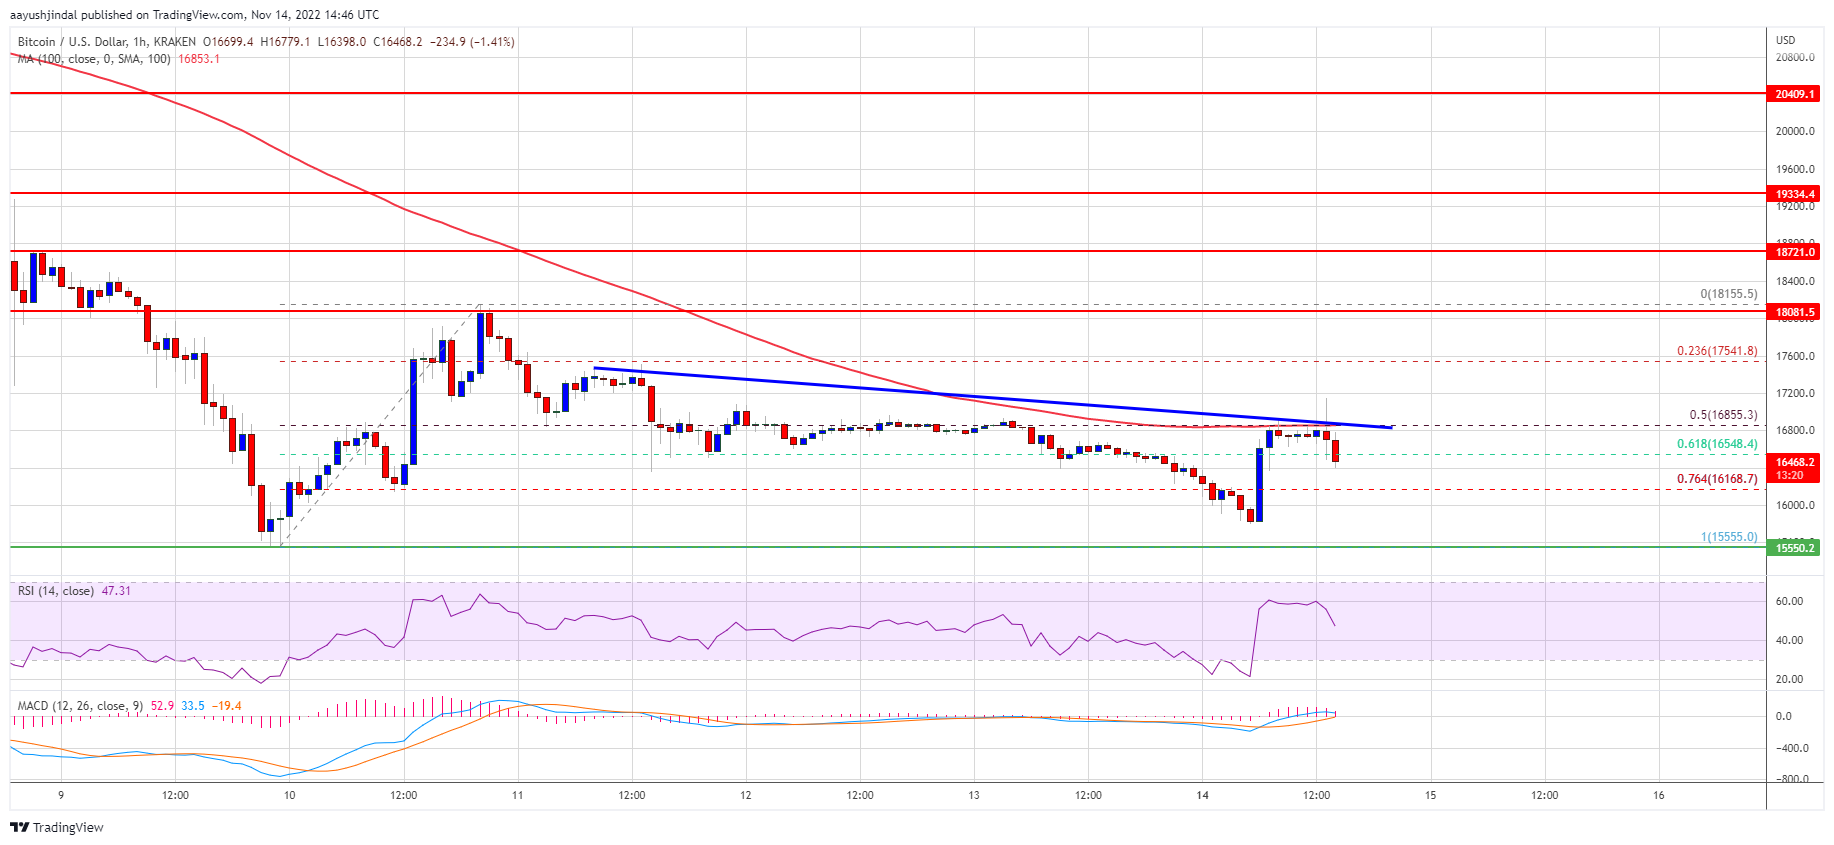
A high was formed near $18,155 and there was a fresh decline, similar to ethereum, bnb, and ripple. The price declined below the $17,500 and $17,200 support levels. The bears pushed the price below the 50% Fib retracement level of the upward move from the $15,555 swing low to $18,155 high.
Bitcoin price is now trading below $18,000 and the 100 hourly simple moving average. Besides, there is a key bearish trend line forming with resistance near $16,400 on the hourly chart of the BTC/USD pair.
The price also spiked once below the 76.4% Fib retracement level of the upward move from the $15,555 swing low to $18,155 high. On the upside, an immediate resistance is near the $16,800 level and the trend line. The first major resistance is near the $17,000 level and the 100 hourly simple moving average.
Source: BTCUSD on TradingView.com
A clear move above the $17,000 resistance might push the price further higher. The next major resistance is near $17,500, above which the price could test the $18,000 zone.
If bitcoin fails to start a recovery wave above the $17,000 resistance zone, it could continue to move down. An immediate support on the downside is near the $16,000 level.
The next major support is near the $15,550 zone. A clear move below the $15,550 support might push the price further lower. In this case, the price may perhaps decline towards the $15,000 support zone.
Technical indicators:
Hourly MACD – The MACD is now gaining pace in the bearish zone.
Hourly RSI (Relative Strength Index) – The RSI for BTC/USD is now below the 50 level.
Major Support Levels – $16,000, followed by $15,550.
Major Resistance Levels – $16,800, $17,000 and $17,500.
Bitcoin price failed to clear $18,000 and started a fresh decline. BTC is showing bearish signs and it might soon decline towards the $15,000 level.
Bitcoin started a fresh decline from the $18,000 and $18,150 resistance levels.
The price is trading below $18,000 and the 100 hourly simple moving average.
There is a key bearish trend line forming with resistance near $16,600 on the hourly chart of the BTC/USD pair (data feed from Kraken).
The pair could resume its decline below the $15,500 support zone in the near term.
Bitcoin price attempted a recovery wave above the $17,500 resistance zone. However, BTC failed to gain strength above the $18,000 resistance and stayed below the 100 hourly simple moving average.
A high was formed near $18,155 and there was a fresh decline, similar to ethereum, bnb, and ripple. The price declined below the $17,500 and $17,200 support levels. The bears pushed the price below the 50% Fib retracement level of the upward move from the $15,555 swing low to $18,155 high.
Bitcoin price is now trading below $18,000 and the 100 hourly simple moving average. Besides, there is a key bearish trend line forming with resistance near $16,400 on the hourly chart of the BTC/USD pair.
The price also spiked once below the 76.4% Fib retracement level of the upward move from the $15,555 swing low to $18,155 high. On the upside, an immediate resistance is near the $16,800 level and the trend line. The first major resistance is near the $17,000 level and the 100 hourly simple moving average.
Source: BTCUSD on TradingView.com
A clear move above the $17,000 resistance might push the price further higher. The next major resistance is near $17,500, above which the price could test the $18,000 zone.
If bitcoin fails to start a recovery wave above the $17,000 resistance zone, it could continue to move down. An immediate support on the downside is near the $16,000 level.
The next major support is near the $15,550 zone. A clear move below the $15,550 support might push the price further lower. In this case, the price may perhaps decline towards the $15,000 support zone.
Technical indicators:
Hourly MACD – The MACD is now gaining pace in the bearish zone.
Hourly RSI (Relative Strength Index) – The RSI for BTC/USD is now below the 50 level.
Major Support Levels – $16,000, followed by $15,550.
Major Resistance Levels – $16,800, $17,000 and $17,500.
Tags: bitcoinbtcusdBTCUSDTxbtusd
NewsBTCRead More
Bitcoin’s latest pullback was not driven by a single headline. Instead, traders were hit by…
Tokenized stock trading fueled fresh momentum across the Solana ecosystem, while Aave founder hinted at…
Ripple CTO Emeritus David Schwartz has clarified a long-running point of confusion in the XRP…
Bitcoin Magazine Billionaire Investor Jeremy Grantham: Bitcoin Will ‘Dwindle Away With a Whimper’ Legendary investor…
TL;DR Bitcoin fell below the $59,000 threshold as macro pressure returned to crypto markets. The…
TL;DR Bitcoin options positioning has shifted toward downside protection, according to Deribit and Block Scholes…