Bitcoin price corrected gains and tested the $66,500 support. BTC is now struggling and might decline further below the $65,000 zone.
Bitcoin is struggling to recover losses and moving lower below $67,500.
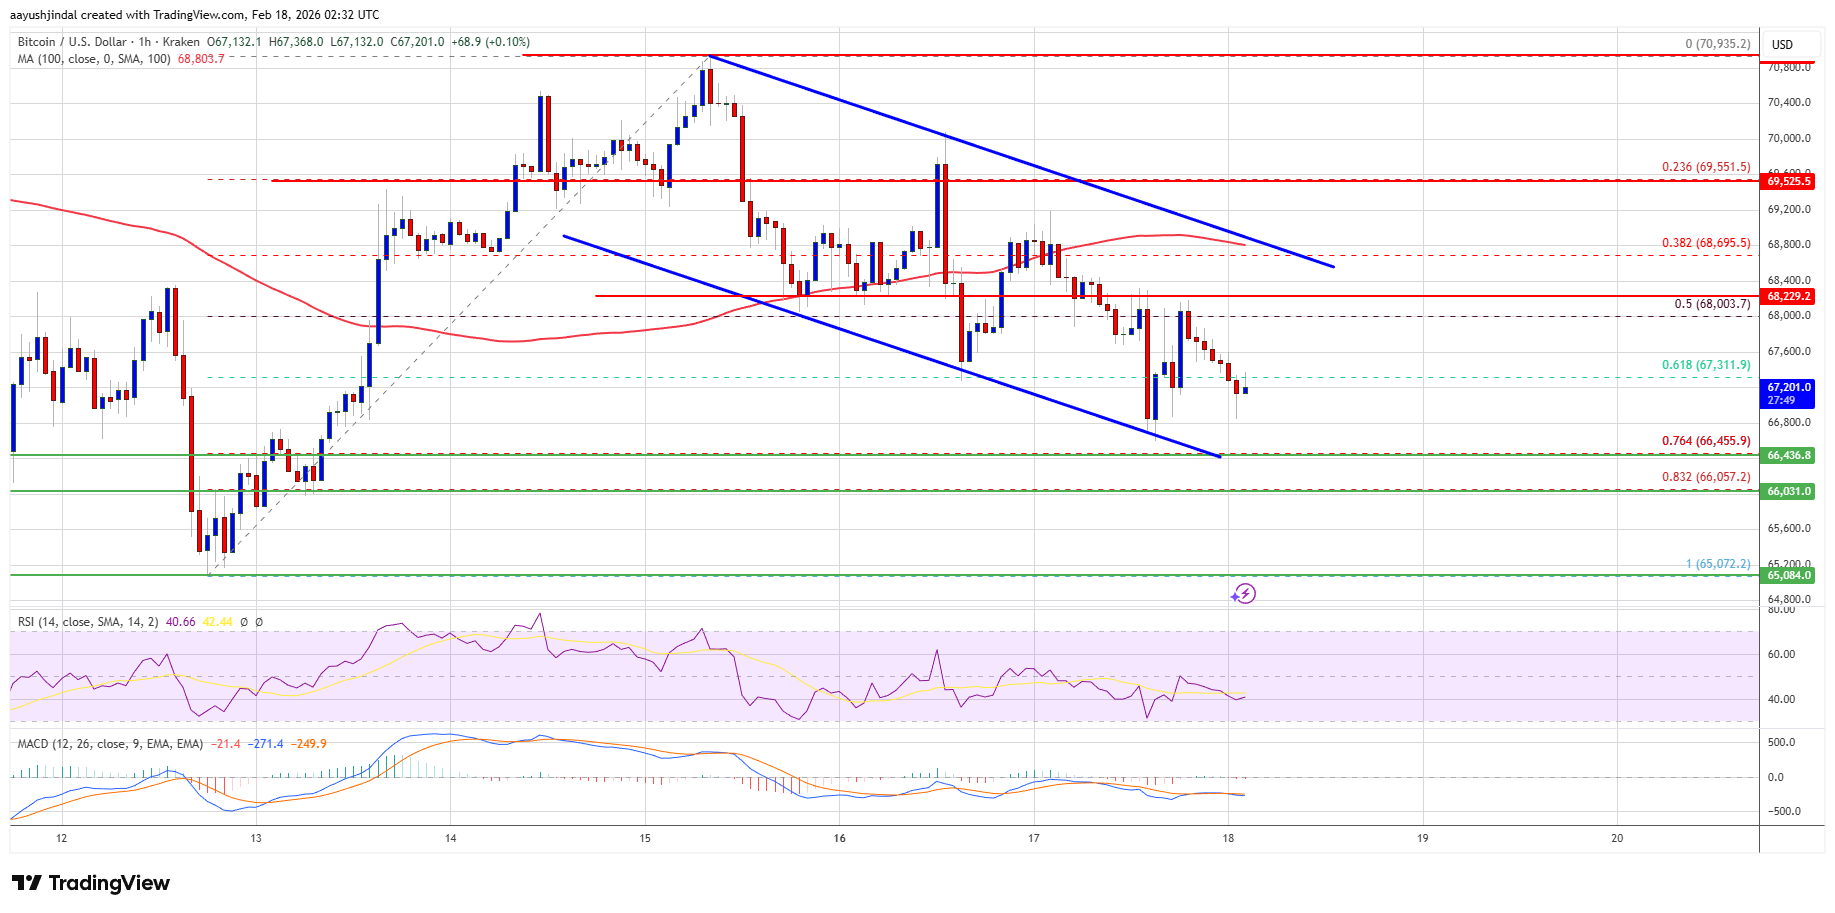
The price is trading below $67,500 and the 100 hourly simple moving average.
There is a declining channel forming with resistance at $68,850 on the hourly chart of the BTC/USD pair (data feed from Kraken).
The pair might dip again if it trades below the $66,500 and $66,000 levels.
Bitcoin price failed to remain stable above the $68,500 zone. BTC started a fresh decline and traded below the $67,800 support zone. There was a push below $67,200.
The price dipped below the 61.8% Fib retracement level of the upward move from the $65,072 swing low to the $70,935 high. However, the bulls remained active near the $66,500 zone. Besides, there is a declining channel forming with resistance at $68,850 on the hourly chart of the BTC/USD pair.
Bitcoin is now trading below $67,500 and the 100 hourly simple moving average. If the price remains stable above $66,500, it could attempt a fresh increase. Immediate resistance is near the $68,000 level.
The first key resistance is near the $68,850 level. A close above the $68,850 resistance might send the price further higher. In the stated case, the price could rise and test the $69,200 resistance. Any more gains might send the price toward the $70,000 level. The next barrier for the bulls could be $7`,200 and $72,000.
If Bitcoin fails to rise above the $68,850 resistance zone, it could start another decline. Immediate support is near the $66,500 level or the 76.4% Fib retracement level of the upward move from the $65,072 swing low to the $70,935 high. The first major support is near the $66,000 level.
The next support is now near the $65,000 zone. Any more losses might send the price toward the $64,200 support in the near term. The main support now sits at $63,500, below which BTC might struggle to recover in the near term.
Technical indicators:
Hourly MACD – The MACD is now gaining pace in the bullish zone.
Hourly RSI (Relative Strength Index) – The RSI for BTC/USD is now below the 50 level.
Major Support Levels – $66,500, followed by $66,000.
Major Resistance Levels – $68,000 and $68,850.
[#item_full_content]NewsBTCRead MoreCrypto analyst Ardi has pointed to a bear market divergence to explain what has been…
Bitcoin is hovering near the $71,000 mark, consolidating after recent swings as the market digests…
First-quarter purchases have reached 89,618 BTC so far, the most since fourth-quarter 2024, and the…
Bitcoin (BTC) is showing early signs of a prolonged decline after peaking in October 2025.…
According to a recent on-chain data evaluation, the Bitcoin price might not be seeing a…
The Bitcoin market remains subject to high uncertainty, with bearish sentiments at heightened levels. In…