Bitcoin price started a downside correction from the $123,200 zone. BTC is now trading below $120,000 and might find bids near the $115,500 zone.
Bitcoin started a fresh decline from the new all-time high near $123,200.
The price is trading below $120,000 and the 100 hourly Simple moving average.
There was a break above a bearish trend line with resistance at $117,300 on the hourly chart of the BTC/USD pair (data feed from Kraken).
The pair might start another increase if it clears the $120,000 resistance zone.
Bitcoin price started a fresh increase after it cleared the $118,500 resistance zone. BTC gained pace for a move above the $120,000 and $122,000 resistance.
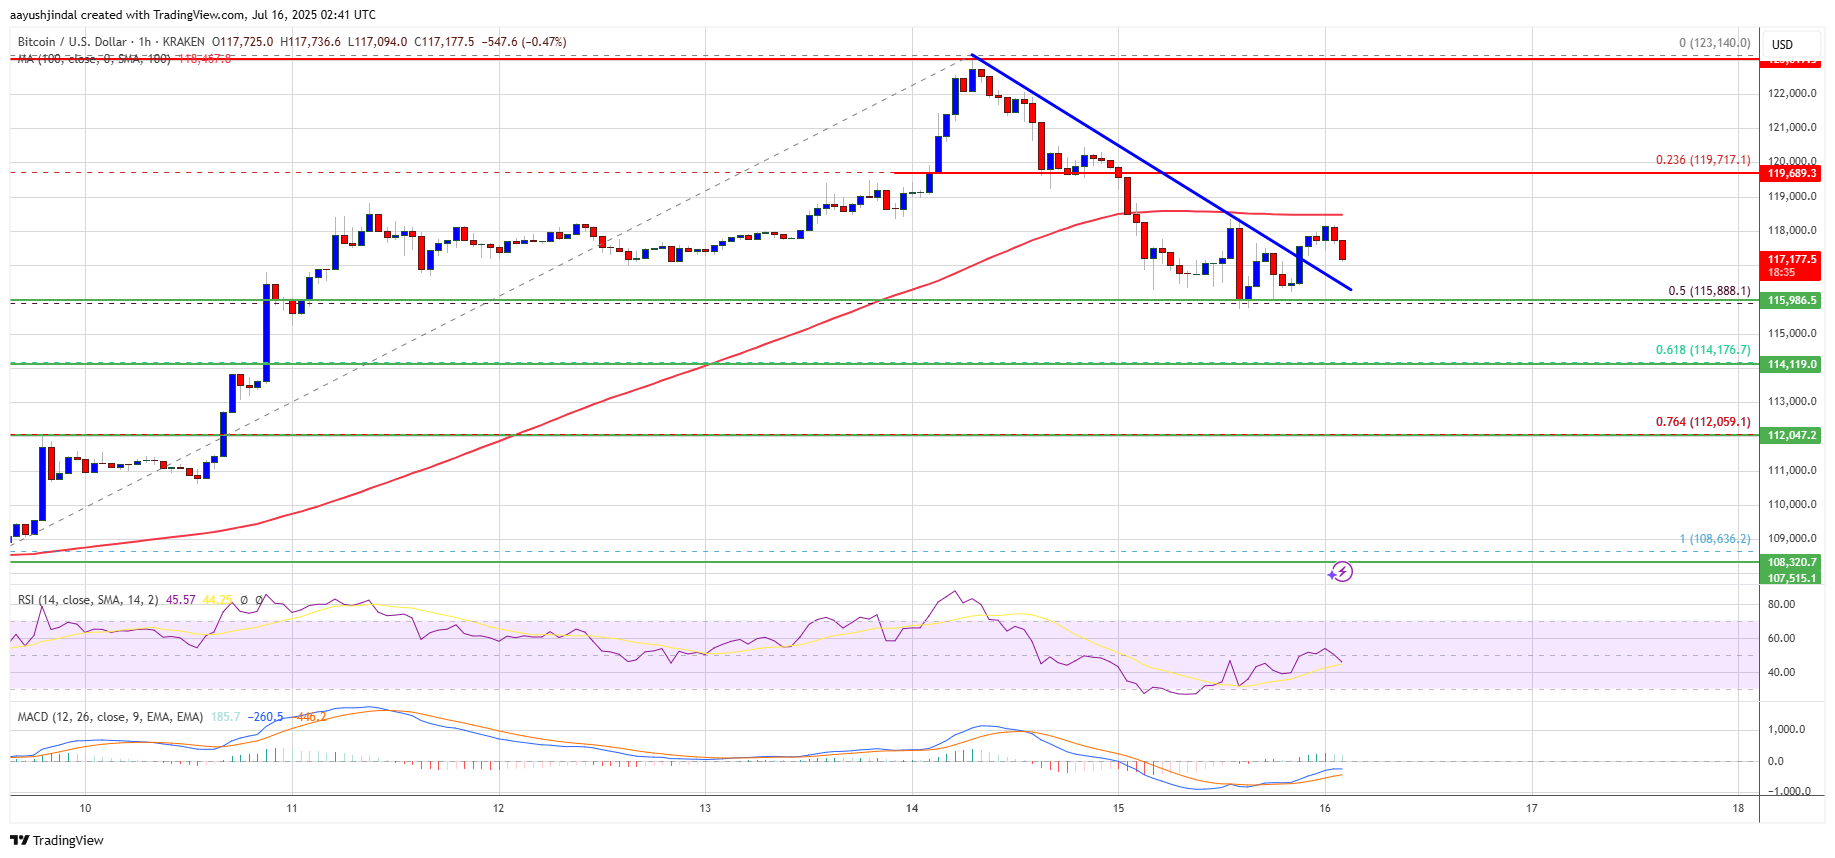
The bulls even pumped the pair above the $123,000 zone. A new all-time high was formed at $123,140 and the price is now correcting gains. There was a move below the 23.6% Fib retracement level of the upward move from the $108,636 swing low to the $123,140 high.
Bitcoin is now trading below $120,500 and the 100 hourly Simple moving average. However, the price is holding the 50% Fib level of the upward move from the $108,636 swing low to the $123,140 high.
Besides, there was a break above a bearish trend line with resistance at $117,300 on the hourly chart of the BTC/USD pair. Immediate resistance on the upside is near the $118,500 level. The first key resistance is near the $120,000 level. The next resistance could be $122,000.
A close above the $122,000 resistance might send the price further higher. In the stated case, the price could rise and test the $123,200 resistance level. Any more gains might send the price toward the $125,000 level. The main target could be $130,000.
If Bitcoin fails to rise above the $120,000 resistance zone, it could continue to move down. Immediate support is near the $115,850 level. The first major support is near the $115,500 level.
The next support is now near the $114,150 zone. Any more losses might send the price toward the $112,500 support in the near term. The main support sits at $110,500, below which BTC might continue to move down.
Technical indicators:
Hourly MACD – The MACD is now losing pace in the bearish zone.
Hourly RSI (Relative Strength Index) – The RSI for BTC/USD is now below the 50 level.
Major Support Levels – $115,500, followed by $114,150.
Major Resistance Levels – $120,000 and $122,000.
[#item_full_content]NewsBTCRead MoreRipple CTO Emeritus David Schwartz has clarified a long-running point of confusion in the XRP…
Bitcoin Magazine Billionaire Investor Jeremy Grantham: Bitcoin Will ‘Dwindle Away With a Whimper’ Legendary investor…
TL;DR Bitcoin fell below the $59,000 threshold as macro pressure returned to crypto markets. The…
TL;DR Bitcoin options positioning has shifted toward downside protection, according to Deribit and Block Scholes…
TL;DR Oman has launched Omanhash.om, a state-supervised national Bitcoin mining pool. The pool is described…
Bitcoin Magazine ‘I See Volatility as Opportunity’: Bitcoin Tests Critical Support as Key Level Hangs…