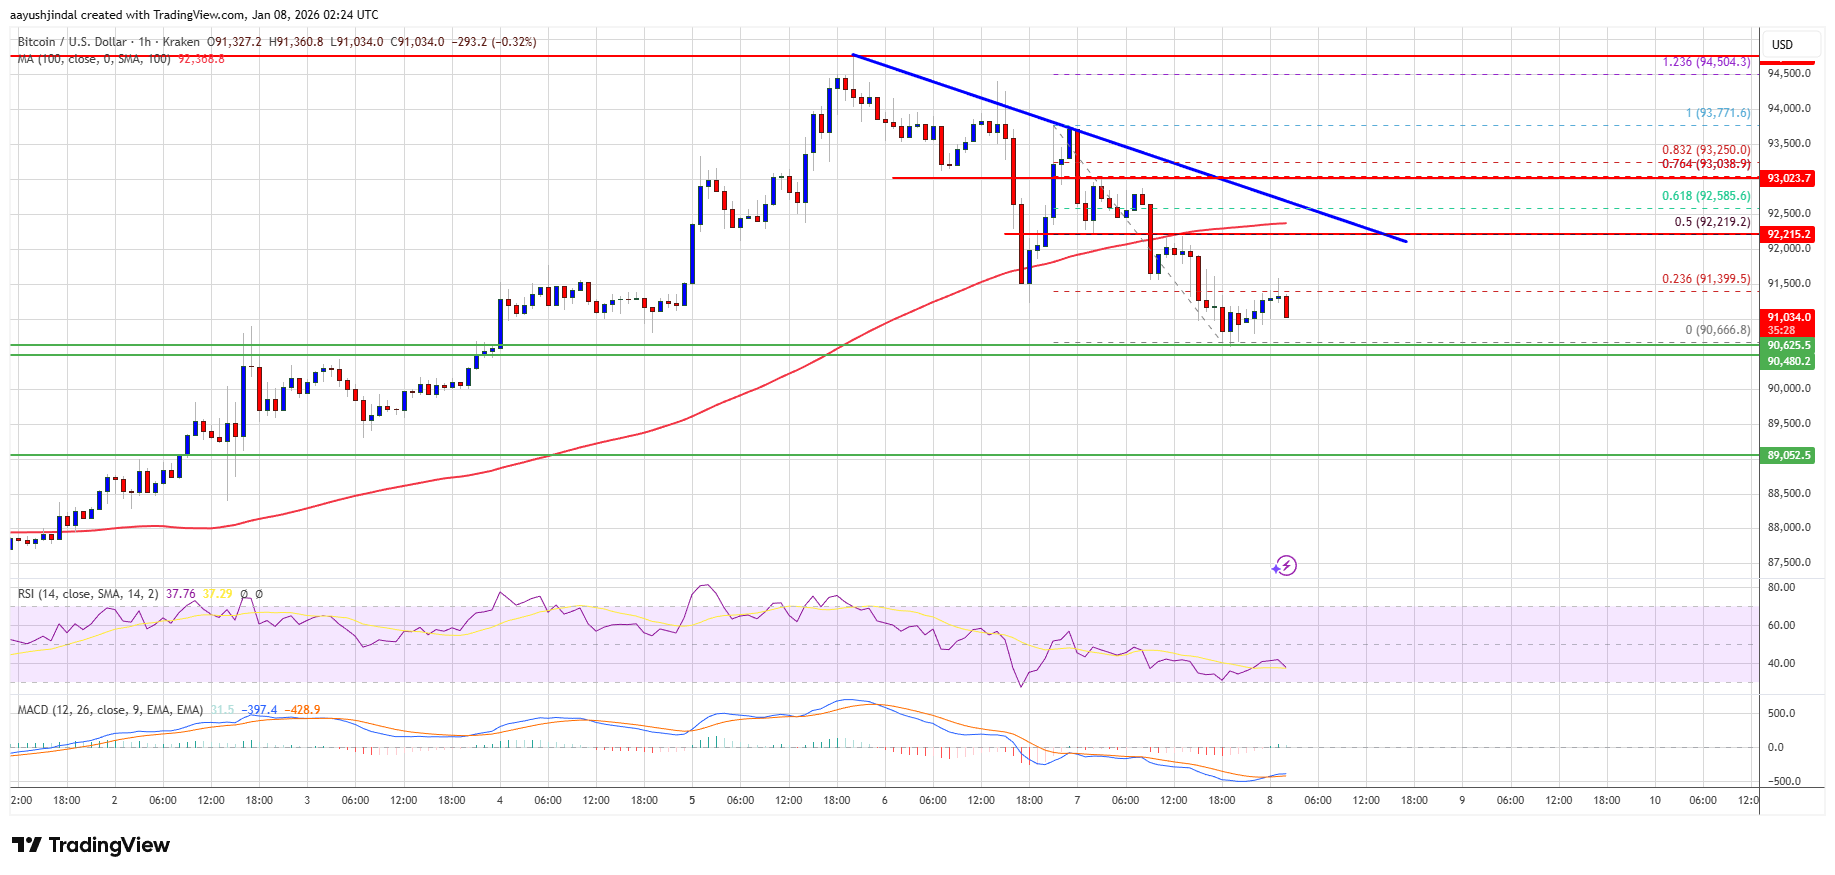
Bitcoin price started a downside correction from $94,500. BTC is now struggling and might dip toward the key support at $89,000.
Bitcoin started a downside correction and traded below the $92,000 zone.
The price is trading below $92,000 and the 100 hourly Simple moving average.
There is a bearish trend line forming with resistance at $92,650 on the hourly chart of the BTC/USD pair (data feed from Kraken).
The pair might continue to move down if it stays below the $92,500 zone.
Bitcoin price failed to stay above $94,000 and started a downside correction. BTC dipped below $93,200 and $92,500 to enter a short-term bearish zone.
The price even dipped below $92,000 and tested $90,650. A low was formed at $90,666 and the price is now consolidating losses. It tested the 23.6% Fib retracement level of the recent decline from the $93,771 swing high to the $90,666 low.
Bitcoin is now trading below $92,000 and the 100 hourly Simple moving average. Besides, there is a bearish trend line forming with resistance at $92,650 on the hourly chart of the BTC/USD pair.
If the price remains stable above $90,500, it could attempt a fresh increase. Immediate resistance is near the $91,400 level. The first key resistance is near the $92,200 level and the 50% Fib retracement level of the recent decline from the $93,771 swing high to the $90,666 low.
The next resistance could be $92,500. A close above the $92,500 resistance might send the price further higher. In the stated case, the price could rise and test the $93,050 resistance. Any more gains might send the price toward the $93,800 level. The next barrier for the bulls could be $94,000 and $94,500.
If Bitcoin fails to rise above the $92,500 resistance zone, it could start another decline. Immediate support is near the $90,500 level. The first major support is near the $90,000 level.
The next support is now near the $89,000 zone. Any more losses might send the price toward the $87,200 support in the near term. The main support sits at $86,000, below which BTC might accelerate lower in the near term.
Technical indicators:
Hourly MACD – The MACD is now gaining pace in the bearish zone.
Hourly RSI (Relative Strength Index) – The RSI for BTC/USD is now below the 50 level.
Major Support Levels – $90,500, followed by $90,000.
Major Resistance Levels – $92,200 and $92,500.
[#item_full_content]NewsBTCRead MoreMarkets are also looking ahead to Fed Chair Kevin Warsh's keynote speech at the Jackson…
Your day-ahead look for Aug. 26, 2026Read MoreCoinDesk: Bitcoin, Ethereum, Crypto News and Price Data[#item_full_content]
The price of bitcoin fell to $79,000 on Wednesday after gaining 23% in seven days…
Friday’s expiry follows bitcoin’s surge from $62,000 to $80,000, leaving market makers with increased exposure…
ETF issuers are lowering the barrier for bitcoin whales to trade self-custody for ETF shares.Read…
Every major token fell over 24 hours except HYPE, though bitcoin holds a 23% weekly…