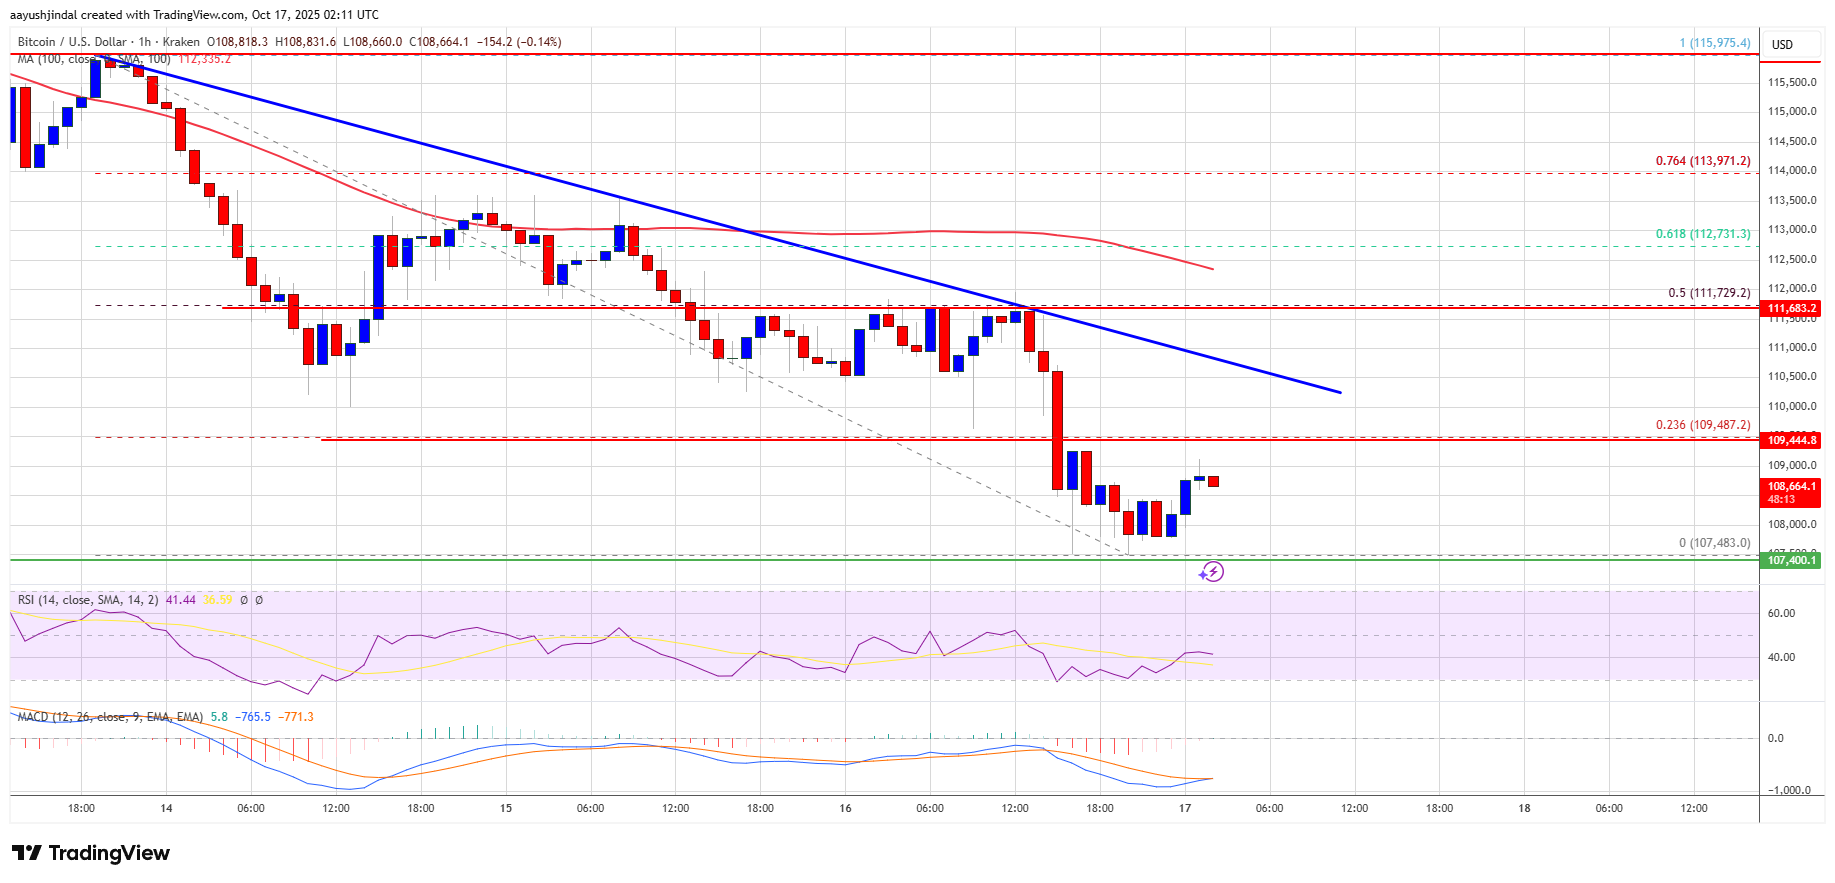
Bitcoin price is struggling to settle above $112,500 and $113,000. BTC is now moving lower and might start another decline below $108,000.
Bitcoin started a fresh decline after it failed to clear the $113,000 resistance level.
The price is trading below $110,000 and the 100 hourly Simple moving average.
There is a bearish trend line forming with resistance at $110,500 on the hourly chart of the BTC/USD pair (data feed from Kraken).
The pair might continue to move down if it trades below the $107,500 zone.
Bitcoin price failed to surpass the $113,000 resistance level and started a fresh decline. BTC dipped below the $112,000 and $110,500 support levels to enter a bearish zone.
The price even dipped below $108,000. A low was formed at $107,483 and the price is now consolidating losses below the 23.6% Fib retracement level of the recent decline from the $115,975 swing high to the $107,483 low.
Bitcoin is now trading below $110,000 and the 100 hourly Simple moving average. Besides, there is a bearish trend line forming with resistance at $110,500 on the hourly chart of the BTC/USD pair. Immediate resistance on the upside is near the $109,500 level.
The first key resistance is near the $110,000 level. The next resistance could be $110,500 and the trend line. A close above the $110,500 resistance might send the price further higher. In the stated case, the price could rise and test the $111,800 resistance since it is close to the 50% Fib retracement level of the recent decline from the $115,975 swing high to the $107,483 low. Any more gains might send the price toward the $112,500 level. The next barrier for the bulls could be $113,000.
If Bitcoin fails to rise above the $110,000 resistance zone, it could start a fresh decline. Immediate support is near the $108,000 level. The first major support is near the $107,500 level.
The next support is now near the $106,200 zone. Any more losses might send the price toward the $105,500 support in the near term. The main support sits at $103,200, below which BTC might struggle to recover in the short term.
Technical indicators:
Hourly MACD – The MACD is now gaining pace in the bearish zone.
Hourly RSI (Relative Strength Index) – The RSI for BTC/USD is now below the 50 level.
Major Support Levels – $108,000, followed by $107,500.
Major Resistance Levels – $110,000 and $110,500.
[#item_full_content]NewsBTCRead MoreYour day-ahead look for Aug. 28, 2026Read MoreCoinDesk: Bitcoin, Ethereum, Crypto News and Price Data[#item_full_content]
BTC briefly touched $81,455 overnight, its highest since May 15 as Nasdaq futures slipped and…
The $6.4 billion expiry cleared after bitcoin’s run from roughly $62,000 to $80,000, leaving traders…
Bitcoin Magazine Pakistan Built Its Crypto Regulatory Regime Using Just 8% of Its Budget, Minister…
Warsh’s Jackson Hole speech could shape expectations for Fed support of Treasury buybacks, with implications…
The indictor has flipped positive for the first time since May as BTC looks to…