Bitcoin price extended losses and traded below $68,800 support. BTC is now consolidating and facing hurdles near the $70,000 resistance zone.
Bitcoin extended its decline below the $68,800 support zone.
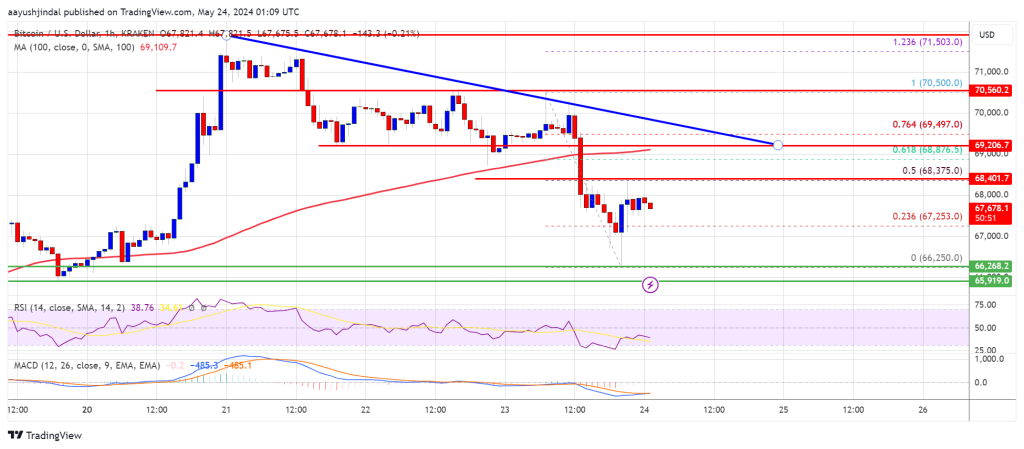
The price is trading below $69,000 and the 100 hourly Simple moving average.
There is a key bearish trend line forming with resistance at $69,200 on the hourly chart of the BTC/USD pair (data feed from Kraken).
The pair could continue to move done unless the bulls push it back above $70,000.
Bitcoin price started a downside correction below the $70,000 support zone. BTC bears were able to push the price below major support at $68,800. It sparked bearish moves and the price dipped toward $66,250.
A low was formed at $66,250 and the price is now consolidating losses. There was a minor increase above the $67,250 level. The price climbed above the 23.6% Fib retracement level of the downward move from the $70,500 swing high to the $66,250 low.
However, the bears are active near the $68,350 level and the 50% Fib retracement level of the downward move from the $70,500 swing high to the $66,250 low. Bitcoin price is now trading below $69,000 and the 100 hourly Simple moving average.
If there is a fresh increase, the price might face resistance near the $68,350 level. The first major resistance could be $68,800. There is also a key bearish trend line forming with resistance at $69,200 on the hourly chart of the BTC/USD pair.
The next key resistance could be $70,000. A clear move above the $70,000 resistance might send the price higher. In the stated case, the price could rise and test the $70,500 resistance.
If the bulls push the price further higher, there could be a move toward the $71,200 resistance zone. Any more gains might send BTC toward the $71,800 resistance.
If Bitcoin fails to climb above the $69,800 resistance zone, it could continue to move down. Immediate support on the downside is near the $67,250 level.
The first major support is $66,800. The next support is now forming near $66,250. Any more losses might send the price toward the $65,000 support zone in the near term.
Technical indicators:
Hourly MACD – The MACD is now losing pace in the bearish zone.
Hourly RSI (Relative Strength Index) – The RSI for BTC/USD is now below the 50 level.
Major Support Levels – $67,250, followed by $66,250.
Major Resistance Levels – $68,350, $68,800, and $70,000.
[#item_full_content]NewsBTCRead MoreKey factors, such as ETF flows, macro factors and on-chain supply favor a rally in…
"Effective immediately, the United States Navy ... will begin the process of blockading any and…
Bitcoin traded as high as $73,000 following a 9% price rally in the past week.…
Sudden selloff triggered liquidation-style move, with weak recovery reinforcing bearish structure despite compressed volatility setup.Read…
The Bitcoin price has been one to watch over the past week, jumping by nearly…
U.S. Vice President J.D. Vance said negotiations had ended after a daylong session in Pakistan,…