Bitcoin price failed to clear the $65,500 resistance. BTC is now moving lower and there are a few bearish signs emerging below the $63,500 level.
Bitcoin started a fresh downside correction and traded below $63,500.
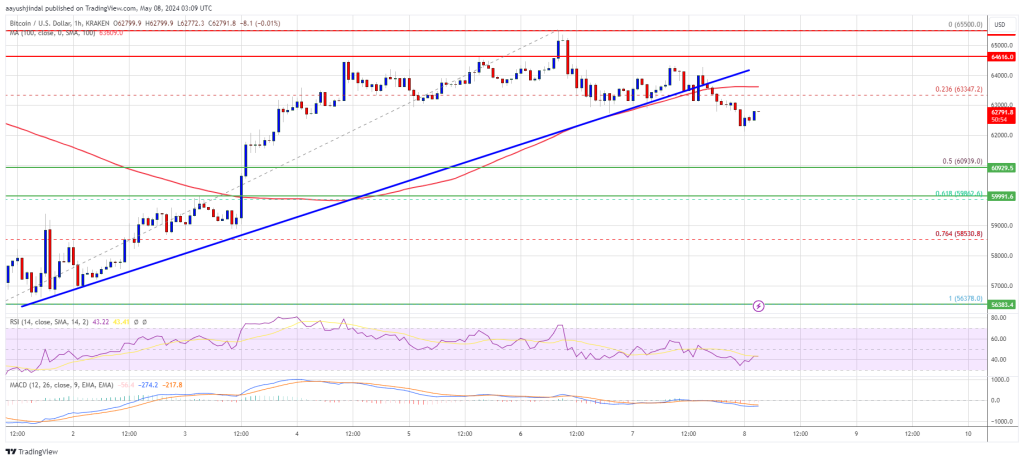
The price is trading below $63,350 and the 100 hourly Simple moving average.
There was a break below a major bullish trend line with support at $63,700 on the hourly chart of the BTC/USD pair (data feed from Kraken).
The pair could extend losses and revisit the $60,000 support zone in the near term.
Bitcoin price extended its increase above the $64,500 level. However, BTC struggled to clear the $65,500 resistance zone. A high was formed at $65,550 and the price is now correcting gains.
There was a move below the $64,000 level. The price declined below the 23.6% Fib retracement level of the upward wave from the $56,380 swing low to the $65,550 high. Besides, there was a break below a major bullish trend line with support at $63,700 on the hourly chart of the BTC/USD pair.
Bitcoin is now trading below $63,500 and the 100 hourly Simple moving average. Immediate resistance is near the $63,350 level. The first major resistance could be $64,000. The next key resistance could be $65,000.
Source: BTCUSD on TradingView.com
The main hurdle is now at $65,500. A clear move above the $65,500 resistance might send the price higher. The next resistance now sits at $66,650. If there is a close above the $66,650 resistance zone, the price could continue to move up. In the stated case, the price could rise toward $68,000.
If Bitcoin fails to climb above the $63,500 resistance zone, it could continue to move down. Immediate support on the downside is near the $62,000 level.
The first major support is $61,000 or the 50% Fib retracement level of the upward wave from the $56,380 swing low to the $65,550 high. If there is a close below $61,000, the price could start to drop toward $60,000. Any more losses might send the price toward the $58,000 support zone in the near term.
Technical indicators:
Hourly MACD – The MACD is now gaining pace in the bearish zone.
Hourly RSI (Relative Strength Index) – The RSI for BTC/USD is now below the 50 level.
Major Support Levels – $62,000, followed by $60,000.
Major Resistance Levels – $63,500, $64,000, and $65,500.
[#item_full_content]NewsBTCRead MoreData shows the Bitcoin perpetual futures market has seen a negative Funding Rate recently, suggesting…
Despite the crypto market’s renewed weakness on Thursday, a new AI-driven market model produced by…
The recent price action echoes the November–January pattern, showing weak conviction among the “buy the…
Morgan Stanley has filed to launch a spot Bitcoin ETF with the ticker MSBT and…
Oil prices slipped as major economies announced joint efforts to stabilize energy markets.Read MoreCoinDesk: Bitcoin,…
BTQ Technologies moved a key Bitcoin (BTC) security proposal from theory to practice on Thursday,…