Bitcoin price failed to climb above the $66,500 resistance. BTC is again moving lower and might decline below the $64,600 support zone.
Bitcoin started a fresh decline from the $66,500 resistance level.
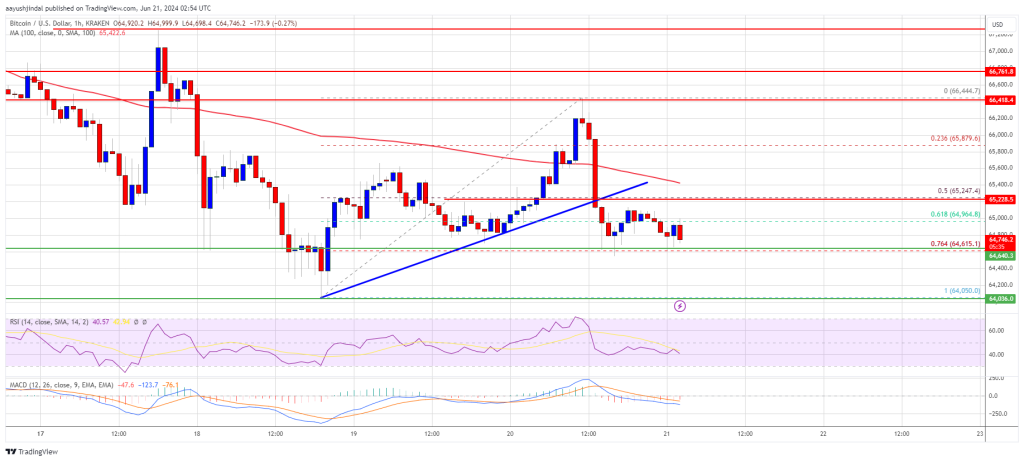
The price is trading below $65,500 and the 100 hourly Simple moving average.
There was a break below a connecting bullish trend line with support at $65,250 on the hourly chart of the BTC/USD pair (data feed from Kraken).
The pair could extend losses if there is a clear move below the $64,600 and $64,200 support levels.
Bitcoin price started a recovery wave above the $65,000 level. BTC climbed above the $65,500 and $66,200 levels. However, the bears were active near the $66,500 zone. A high was formed at $66,444 and the price started another decline.
There was a move below the $65,500 and $65,400 support levels. The price dipped below the 50% Fib retracement level of the upward move from the $64,050 swing low to the $66,444 high. Besides, there was a break below a connecting bullish trend line with support at $65,250 on the hourly chart of the BTC/USD pair
The price tested the $64,600 support zone and the 76.4% Fib retracement level of the upward move from the $64,050 swing low to the $66,444 high.
Bitcoin is now trading below $65,500 and the 100 hourly Simple moving average. If there is another upward move, the price might face resistance near the $65,250 level. The first major resistance could be $65,500. The next key resistance could be $66,000.
A clear move above the $66,000 resistance might start a steady increase and send the price higher. In the stated case, the price could rise and test the $66,500 resistance. Any more gains might send BTC toward the $67,500 resistance in the near term.
If Bitcoin fails to climb above the $65,250 resistance zone, it could continue to move down. Immediate support on the downside is near the $64,600 level.
The first major support is $64,200. The next support is now forming near $64,000. Any more losses might send the price toward the $63,200 support zone in the near term.
Technical indicators:
Hourly MACD – The MACD is now gaining pace in the bearish zone.
Hourly RSI (Relative Strength Index) – The RSI for BTC/USD is now below the 50 level.
Major Support Levels – $64,600, followed by $64,000.
Major Resistance Levels – $65,250, and $66,500.
[#item_full_content]NewsBTCRead MoreDevelopers are considering ways to quantum-proof the world's oldest cryptocurrency as the threat of this…
Bitcoin is showing signs of hesitation at the $66,000 level, with price action slipping into…
Adoption of Bitcoin and Ethereum is poised to take a significant step forward as Charles…
The study analyzed 60-day windows after economic or geopolitical shocks and found that Bitcoin posted…
The Bitcoin price recently broke down to $66,000, and a bearish retest of $69,000 has…
Kwasi Kwarteng reflects on current UK market turmoil, fiscal “doom loop,” and his move into…