Bitcoin price traded to a new all-time high above $69,000 before crashing. BTC is now consolidating near $63,000 and might decline toward the $60,000 support.
Bitcoin price created history again and traded to a new all-time above $69,000.
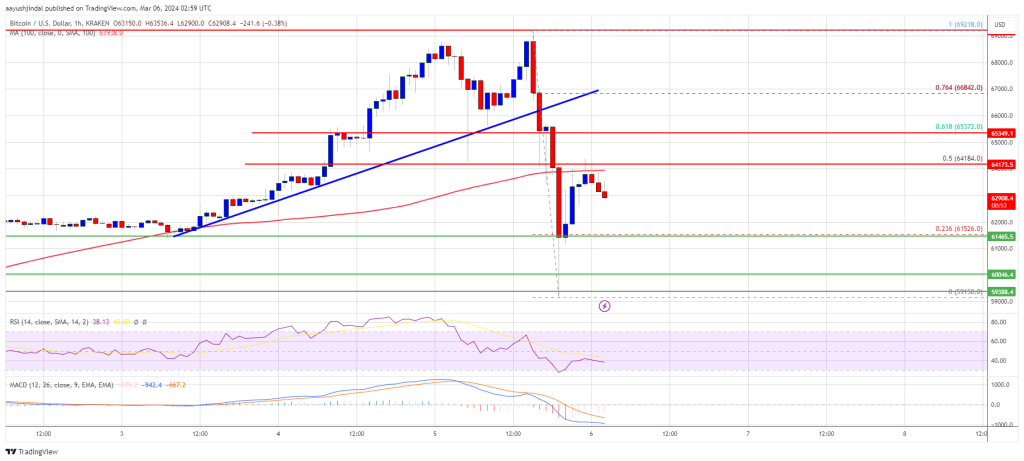
The price is trading below $65,000 and the 100 hourly Simple moving average.
There was a break below a key bullish trend line with support at $66,000 on the hourly chart of the BTC/USD pair (data feed from Kraken).
The pair could extend losses and revisit the key $60,000 support zone.
Bitcoin price extended its increase above the $68,000 resistance. BTC even broke the $68,800 level and traded to a new all-time high at $69,218. However, there was a strong bearish reaction from $69,200.
The price crashed over 10% and dived toward the $60,000 zone. There was a break below a key bullish trend line with support at $66,000 on the hourly chart of the BTC/USD pair. A low was formed near $59,150 and the price is now attempting a recovery wave.
There was a move above the $62,000 resistance. It is now facing resistance near the $64,000 zone and the 50% Fib retracement level of the downward move from the $69,218 swing high to the $59,150 low.
Bitcoin is now trading below $64,000 and the 100 hourly Simple moving average. Immediate resistance is near the $64,000 level. The next key resistance could be $64,200, above which the price could rise toward the $65,500 resistance zone.
Source: BTCUSD on TradingView.com
If there is a clear move above the $65,500 resistance zone or the 61.8% Fib retracement level of the downward move from the $69,218 swing high to the $59,150 low, the price could rise toward the $67,000 level. Any more gains might send the price toward the $70,000 level.
If Bitcoin fails to rise above the $64,200 resistance zone, it could start another downside correction. Immediate support on the downside is near the $62,000 level.
The first major support is $61,500. If there is a close below $61,500, the price could start a decent pullback toward the $60,000 zone. Any more losses might send the price toward the $58,500 support zone.
Technical indicators:
Hourly MACD – The MACD is now gaining pace in the bearish zone.
Hourly RSI (Relative Strength Index) – The RSI for BTC/USD is now below the 50 level.
Major Support Levels – $62,000, followed by $60,000.
Major Resistance Levels – $64,200, $65,500, and $67,000.
[#item_full_content]NewsBTCRead MoreTL;DR Bitcoin recently rebounded from the $58,000 area and was validated near $60,326.78 in the…
For years, investors had valued the firm well above its bitcoin holdings, giving Strategy massive…
TL;DR CryptoQuant-linked data shows Bitcoin apparent demand remaining negative for 208 consecutive days. The metric…
Ripple's Brad Garlinghouse called Strategy's preferred-stock funding model "financial engineering" that distracted the market, pointing…
Bitcoin’s latest pullback was not driven by a single headline. Instead, traders were hit by…
Tokenized stock trading fueled fresh momentum across the Solana ecosystem, while Aave founder hinted at…