Bitcoin price is still struggling to clear the $21,500 resistance zone. BTC could correct further lower if there is a clear move below the $20,500 support zone.
Bitcoin struggled to clear the $21,500 resistance zone and corrected lower.
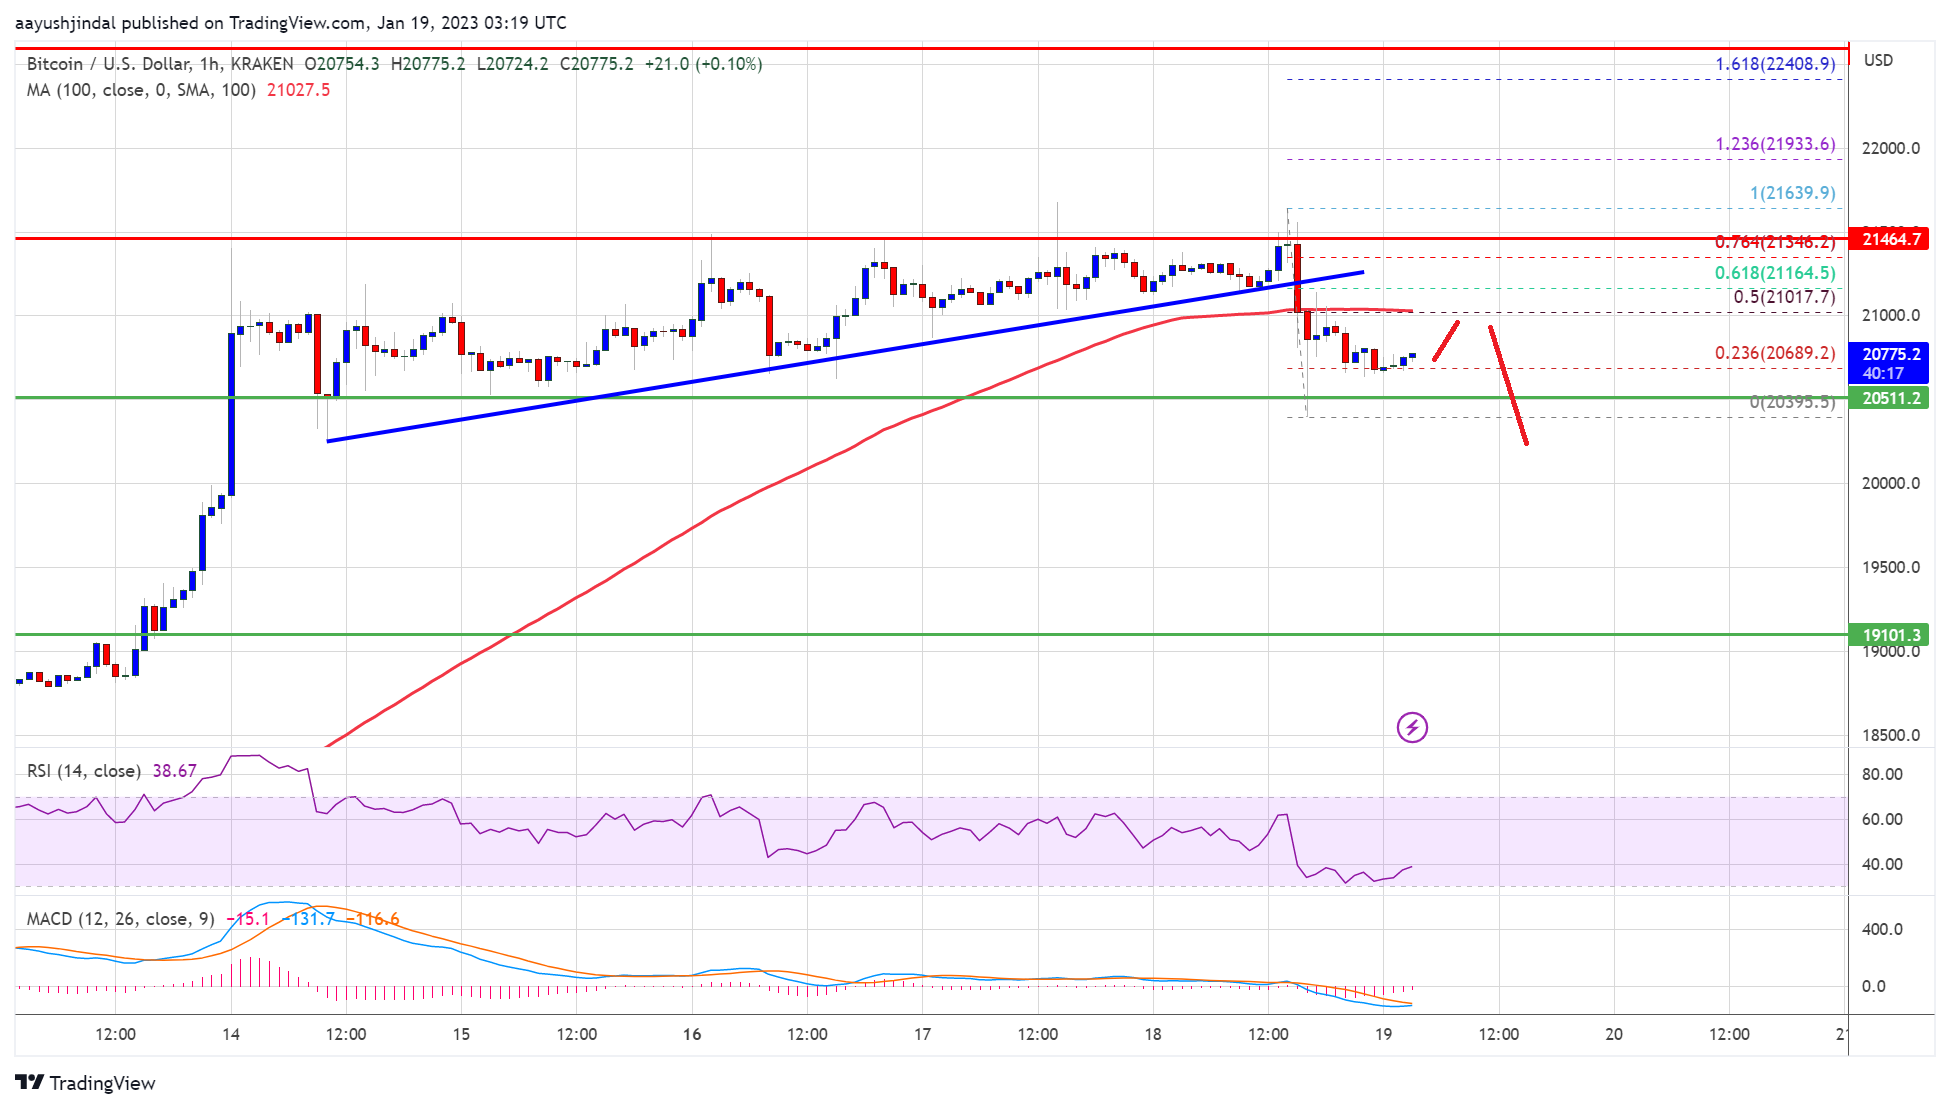
The price is trading below $21,000 and the 100 hourly simple moving average.
There was a break below a key bullish trend line with support near $21,150 on the hourly chart of the BTC/USD pair (data feed from Kraken).
The pair could continue to move down below the $20,650 and $20,500 support levels.
Bitcoin price failed to clear the key hurdle near the $21,500 resistance zone. BTC started a downside correction from the $21,639 swing high. It traded below the $21,500 and $21,250 levels.
There was a break below a key bullish trend line with support near $21,150 on the hourly chart of the BTC/USD pair. The price even broke the $20,800 support zone. A low is formed near $20,395 and the price is now showing a few bearish signs.
Bitcoin price is now trading below $21,000 and the 100 hourly simple moving average. It is consolidating above the 23.6% Fib retracement level of the recent decline from the $21,639 swing high to $20,395 low.
An immediate resistance is near the $20,850 level. The next major resistance is near the $21,080 zone. It is near the 50% Fib retracement level of the recent decline from the $21,639 swing high to $20,395 low, above which the price might gain bullish momentum.
Source: BTCUSD on TradingView.com
In the stated case, the price may perhaps rise towards the $21,500 level. Any more gains might send btc price towards the $22,000 level.
If bitcoin price fails to clear the $21,080 resistance, it could continue to move down. An immediate support on the downside is near the $20,600 zone.
The next major support is near the $20,500 zone, below which the price might accelerate lower towards $20,000. Any more losses might send the price to $19,500, where the bulls may possibly take a stand.
Technical indicators:
Hourly MACD – The MACD is now losing pace in the bearish zone.
Hourly RSI (Relative Strength Index) – The RSI for BTC/USD is now below the 50 level.
Major Support Levels – $20,500, followed by $20,000.
Major Resistance Levels – $21,080, $21,250 and $21,500.
Bitcoin price is still struggling to clear the $21,500 resistance zone. BTC could correct further lower if there is a clear move below the $20,500 support zone.
Bitcoin struggled to clear the $21,500 resistance zone and corrected lower.
The price is trading below $21,000 and the 100 hourly simple moving average.
There was a break below a key bullish trend line with support near $21,150 on the hourly chart of the BTC/USD pair (data feed from Kraken).
The pair could continue to move down below the $20,650 and $20,500 support levels.
Bitcoin price failed to clear the key hurdle near the $21,500 resistance zone. BTC started a downside correction from the $21,639 swing high. It traded below the $21,500 and $21,250 levels.
There was a break below a key bullish trend line with support near $21,150 on the hourly chart of the BTC/USD pair. The price even broke the $20,800 support zone. A low is formed near $20,395 and the price is now showing a few bearish signs.
Bitcoin price is now trading below $21,000 and the 100 hourly simple moving average. It is consolidating above the 23.6% Fib retracement level of the recent decline from the $21,639 swing high to $20,395 low.
An immediate resistance is near the $20,850 level. The next major resistance is near the $21,080 zone. It is near the 50% Fib retracement level of the recent decline from the $21,639 swing high to $20,395 low, above which the price might gain bullish momentum.
Source: BTCUSD on TradingView.com
In the stated case, the price may perhaps rise towards the $21,500 level. Any more gains might send btc price towards the $22,000 level.
If bitcoin price fails to clear the $21,080 resistance, it could continue to move down. An immediate support on the downside is near the $20,600 zone.
The next major support is near the $20,500 zone, below which the price might accelerate lower towards $20,000. Any more losses might send the price to $19,500, where the bulls may possibly take a stand.
Technical indicators:
Hourly MACD – The MACD is now losing pace in the bearish zone.
Hourly RSI (Relative Strength Index) – The RSI for BTC/USD is now below the 50 level.
Major Support Levels – $20,500, followed by $20,000.
Major Resistance Levels – $21,080, $21,250 and $21,500.
Tags: bitcoinbitcoin pricebtcusdBTCUSDTxbtusd
NewsBTCRead More
Bitcoin Magazine Bitcoin Exchange Inflows Spike to 49,000 BTC in a Day, Signaling More Volatility…
Bitcoin Magazine Wavespace Launches MiCA-Compliant Self-Custodial Bitcoin Debit Card Powered by Lightning and NWC Wavespace,…
For readers tracking where the market is actually changing, this is the part that matters.…
The headline number is useful, but the real story is what it says about positioning.…
Miners must redirect their hashrate before the July 31 cutoff, as the pool will stop…
The Nasdaq-listed Korean media company once lined up $1 billion in financing to buy 10,000…