Bitcoin price is consolidating above the $26,000 support. BTC could start a recovery wave if it clears the $26,500 resistance zone in the near term.
Bitcoin is still consolidating above the $26,000 support zone.
The price is trading below $26,400 and the 100 hourly Simple moving average.
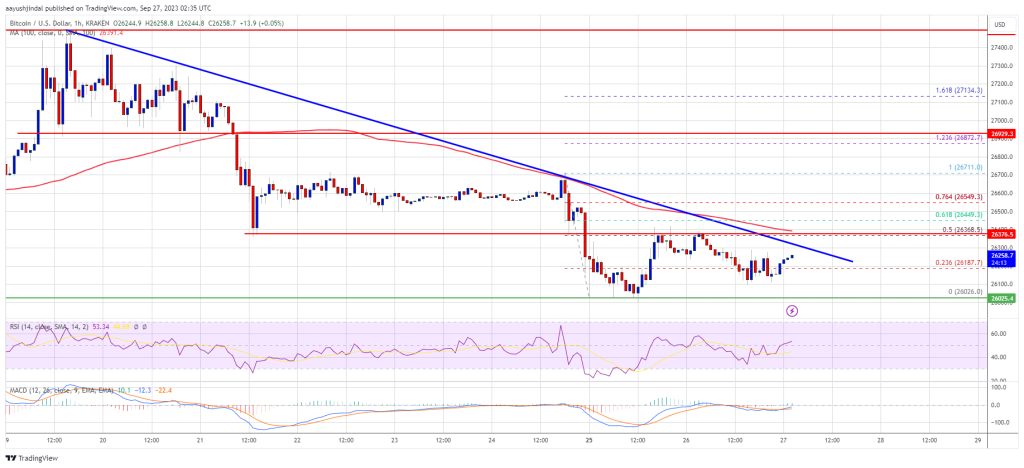
There is a major bearish trend line forming with resistance near $26,300 on the hourly chart of the BTC/USD pair (data feed from Kraken).
The pair could start a decent recovery wave unless there is a clear move below $26,000.
Bitcoin price remained stable above the $26,000 support zone. BTC seems to be forming a short-term support base above the $26,000 level and is currently consolidating.
Recently, the price made a recovery wave attempt above the $26,200 level. However, the bears remained active below the $26,500 level. They rejected the 50% Fib retracement level of the downward move from the $26,712 swing high to the $26,026 low.
Bitcoin is now trading below $26,400 and the 100 hourly Simple moving average. Immediate resistance on the upside is near the $26,300 level. There is also a major bearish trend line forming with resistance near $26,300 on the hourly chart of the BTC/USD pair.
The next key resistance could be near the $26,350 level or the 100 hourly Simple moving average, above which the price could revisit the $26,500 resistance or the 76.4% Fib retracement level of the downward move from the $26,712 swing high to the $26,026 low.
Source: BTCUSD on TradingView.com
To start a recovery wave, the price must settle above $26,500. In the stated case, the price could climb toward the $27,000 resistance. Any more gains might call for a move toward the $27,500 level.
If Bitcoin fails to start a fresh increase above the $26,300 resistance, it could continue to move down. Immediate support on the downside is near the $26,050 level.
The next major support is near the $26,000 level. A downside break and close below the $26,000 level might start another major decline. The next support sits at $25,400. Any more losses might call for a test of $25,000.
Technical indicators:
Hourly MACD – The MACD is now losing pace in the bearish zone.
Hourly RSI (Relative Strength Index) – The RSI for BTC/USD is now near the 50 level.
Major Support Levels – $26,050, followed by $26,000.
Major Resistance Levels – $26,300, $26,500, and $27,000.
[#item_full_content]NewsBTCRead MoreBitcoin and gold pared early losses as the yen gave up gains and Asian stocks…
Bitcoin Magazine China Moves to Confiscate $5 Billion in Bitcoin From Fraudster Who Fled to…
Bitcoin Magazine Bitcoin Slides Towards $81,000 as Oil Above $110 Revives Rate-Hike Bets Bitcoin’s price…
Bitcoin Magazine Utexo Opens Utexo Mint Early Access for USDT on Bitcoin Ahead of November…
Bitcoin Magazine Robinhood Wins Dubai License to Bring Bitcoin and Stock Trading to the Middle…
📺 Watch Video Bitcoin Magazine Matt Crosby: Bitcoin Is “Primed for a Big Move Higher”…