Bitcoin price is slowly moving lower below the $28,500 level. BTC could drop toward the $28,000 level or the 100 hourly SMA before the bulls take a stand.
Bitcoin is struggling to gain traction for a move above the $28,500 level.
The price is trading above $27,750 and the 100 hourly Simple moving average.
There was a break below a key bullish trend line with support near $28,400 on the hourly chart of the BTC/USD pair (data feed from Kraken).
The pair could revisit the 100 hourly Simple moving average before it attempts a fresh increase.
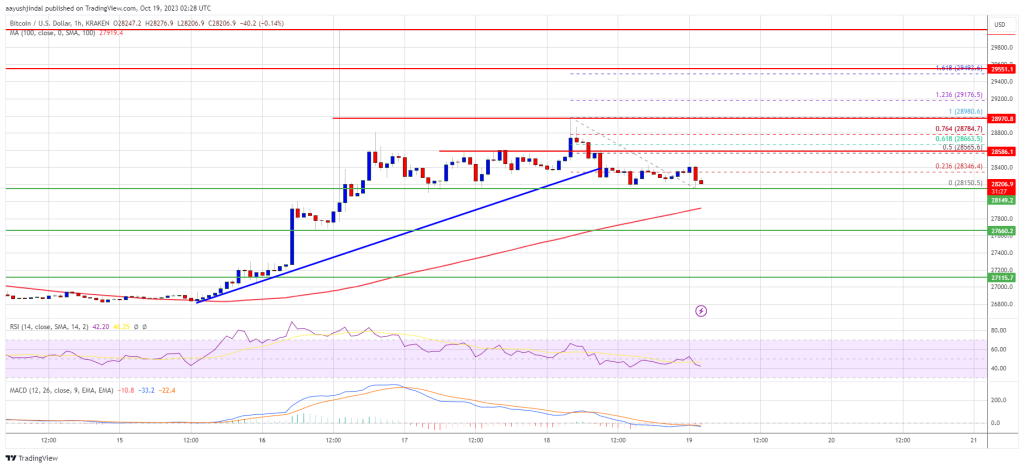
Bitcoin price started a downside correction from the $30,000 resistance zone. BTC struggled to stay in a positive zone and settled below the $28,500 pivot level.
Recently, the bears pushed the price below the $28,200 level. Besides, there was a break below a key bullish trend line with support near $28,400 on the hourly chart of the BTC/USD pair. A low is formed near $28,150 and the price is now consolidating losses.
Bitcoin is now trading above $27,750 and the 100 hourly Simple moving average. On the upside, immediate resistance is near the $28,550 level. It is close to the 50% Fib retracement level of the recent decline from the $28,980 swing high to the $28,150 low.
The next key resistance could be near $28,800 or the 76.4% Fib retracement level of the recent decline from the $28,980 swing high to the $28,150 low.
Source: BTCUSD on TradingView.com
The main resistance is now near the $29,000 zone. A clear move above the $29,000 resistance zone could set the pace for a larger increase. The next key resistance could be $29,500. Any more gains might send BTC toward the $30,000 level.
If Bitcoin fails to rise above the $28,550 resistance zone, it could slide further. Immediate support on the downside is near the $28,150 level.
The next major support is near the $28,000 level and the 100 hourly Simple moving average. A downside break and close below the $28,000 support might trigger more losses in the near term. The next support sits at $27,660, below which it could test $28,120.
Technical indicators:
Hourly MACD – The MACD is now gaining pace in the bearish zone.
Hourly RSI (Relative Strength Index) – The RSI for BTC/USD is now below the 50 level.
Major Support Levels – $28,150, followed by $28,000.
Major Resistance Levels – $28,550, $28,800, and $29,000.
[#item_full_content]NewsBTCRead MoreOn-chain data shows the Bitcoin Whale Transaction Count has witnessed a drawdown recently, a sign…
Key indicators such as ETF inflows cloud the bullish $70,000 holdout storyRead MoreCoinDesk: Bitcoin, Ethereum,…
The Royal Government of Bhutan transferred 519.707 BTC on Wednesday, the latest in a series…
Bitcoin price started a recovery wave above $70,000. BTC is now consolidating above $70,200 and…
Bitcoin remains locked in a tight range, leaving traders uncertain about its next major move.…
Bitcoin’s miner supply picture remains tighter than in past cycles, but not tight enough to…