Bitcoin price is eyeing a fresh increase toward the $28,500 resistance. BTC could start a strong increase if it clears the $28,500 resistance zone.
Bitcoin is holding gains and showing positive signs above the $27,450 zone.
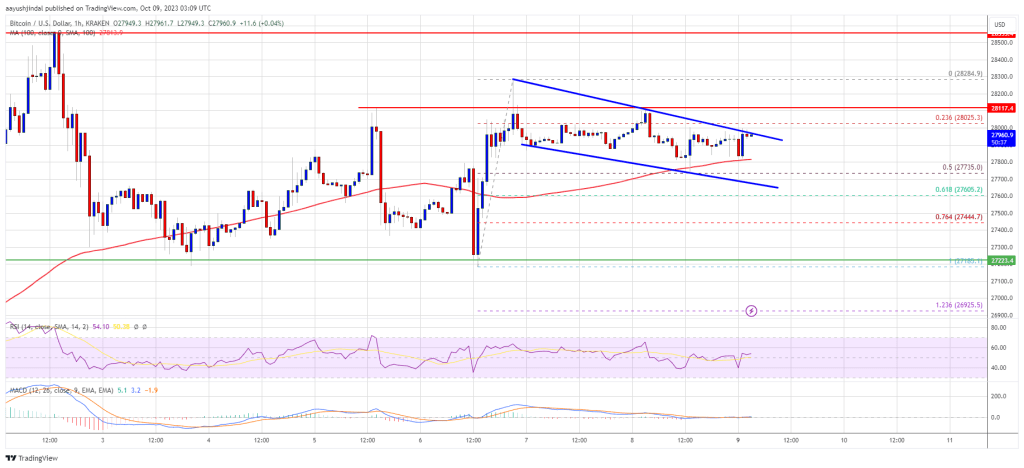
The price is trading above $27,800 and the 100 hourly Simple moving average.
There is a short-term declining channel forming with resistance near $27,980 on the hourly chart of the BTC/USD pair (data feed from Kraken).
The pair could soon revisit the $28,500 resistance zone in the near term.
Bitcoin price started a downside correction after it failed to clear the $28,500 resistance zone. BTC declined below the $28,000 level and tested the $27,200 support zone.
The recent low was formed near $27,185 and the price is again rising. There was a move above the $27,400 and $27,500 resistance levels. A high is formed near $28,284 and the price is now consolidating gains below the 23.6% Fib retracement level of the recent increase from the $27,185 swing low to the $28,284 high.
Bitcoin is now trading above $27,800 and the 100 hourly Simple moving average. The price is now testing the $28,000 resistance zone. There is also a short-term declining channel forming with resistance near $27,980 on the hourly chart of the BTC/USD pair.
Source: BTCUSD on TradingView.com
Immediate resistance on the upside is near the $28,000 level. The next key resistance could be near the $28,500 level. A close above the $28,500 resistance could start another increase. In the stated case, the price could rise toward the $29,200 resistance. Any more gains might call for a move toward the $30,000 level.
If Bitcoin fails to continue higher above the $28,000 resistance, there could be a fresh decline. Immediate support on the downside is near the $27,800 level and the 100 hourly Simple moving average.
The next major support is near the $27,4500 level. The main support is now forming near the $27,200 level. A downside break and close below the $27,200 level might push the price further lower toward $26,650 in the near term. The next support sits at $26,200.
Technical indicators:
Hourly MACD – The MACD is now gaining pace in the bullish zone.
Hourly RSI (Relative Strength Index) – The RSI for BTC/USD is now above the 50 level.
Major Support Levels – $27,800, followed by $27,200.
Major Resistance Levels – $28,000, $28,500, and $29,200.
[#item_full_content]NewsBTCRead MoreBitcoin Magazine David Bailey Confirmed As A Bitcoin 2026 Speaker David Bailey has been officially…
Bitcoin Magazine Paraguay Adopts Stricter Crypto Oversight, Mandates Detailed Transaction on Bitcoin Reporting Paraguay’s National…
Bitcoin Magazine Policy Group Calls for Bitcoin Inclusion in Proposed Crypto Tax Exemption The Bitcoin…
Bitcoin Magazine Corporate Bitcoin Holdings Hit Record High as Institutions Accumulate 2.8x Mining Supply: Report…
Research shows that only 8% to 10% of global Bitcoin hashrate runs in oil-sensitive power…
Today’s quantum computers are far from breaking Bitcoin’s cryptography and any real threat would likely…