Bitcoin price started a decent increase above the $55,500 resistance. BTC is consolidating and might aim for more gains if it clears the $58,000 resistance.
Bitcoin is rising from the $52,500 support zone.
The price is trading above $55,500 and the 100 hourly Simple moving average.
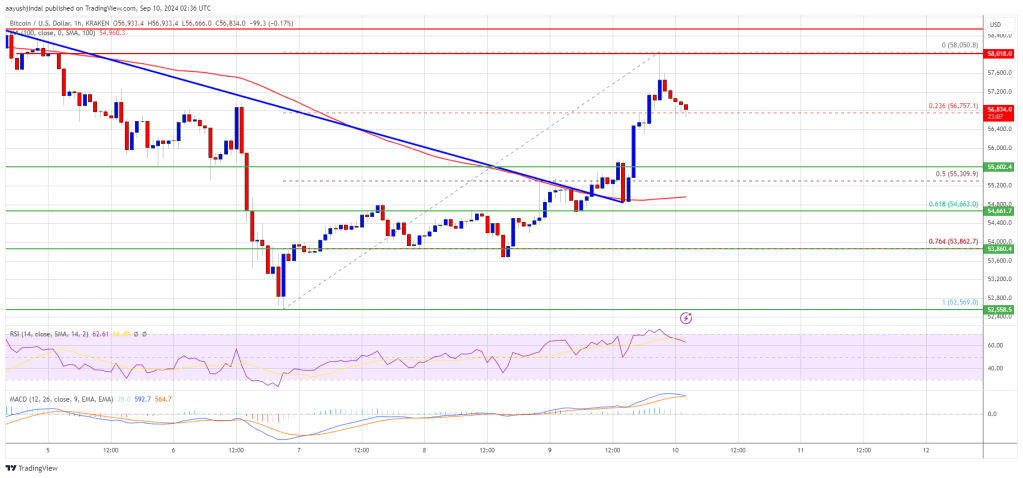
There was a break above a key bearish trend line with resistance at $55,300 on the hourly chart of the BTC/USD pair (data feed from Kraken).
The pair is facing resistance near the $58,000 and $58,200 resistance levels in the near term.
Bitcoin price started a decent increase after it broke the $55,500 resistance zone. BTC gained pace and was able to clear the $56,200 resistance. There was a break above a key bearish trend line with resistance at $55,300 on the hourly chart of the BTC/USD pair.
The pair even spiked above the $58,000 resistance zone. A high was formed at $58,050 and the price is now consolidating gains. There was a minor decline below the $57,500 level. The price dipped below the 23.6% Fib retracement level of the upward move from the $52,569 swing low to the $58,050 high.
Bitcoin is now trading above $55,500 and the 100 hourly Simple moving average. On the upside, the price could face resistance near the $57,500 level. The first key resistance is near the $58,000 level.
A clear move above the $58,000 resistance might send the price further higher in the coming sessions. The next key resistance could be $58,500. A close above the $58,500 resistance might spark more upsides. In the stated case, the price could rise and test the $60,000 resistance.
If Bitcoin fails to rise above the $58,000 resistance zone, it could start another decline. Immediate support on the downside is near the $56,750 level.
The first major support is $55,500 or the 50% Fib retracement level of the upward move from the $52,569 swing low to the $58,050 high. The next support is now near the $53,500 zone. Any more losses might send the price toward the $52,600 support in the near term.
Technical indicators:
Hourly MACD – The MACD is now losing pace in the bullish zone.
Hourly RSI (Relative Strength Index) – The RSI for BTC/USD is now above the 50 level.
Major Support Levels – $56,750, followed by $55,500.
Major Resistance Levels – $57,500, and $58,000.
[#item_full_content]NewsBTCRead MoreBitcoin Magazine Bitcoin Maxi Jack Dorsey Unveils New Open Source Group Chat App Tech entrepreneur…
Bitcoin Magazine Bitcoin is NOT Changed by Proof Of Node You might have heard about…
BTC has rebounded 15% from the July lows, but some analysts cautioned that the next…
The crypto financial services firm is funding developers to strengthen the blockchain's security before quantum…
Claude Fabel 5 disproved the Jacobian conjecture over the weekend, landing days after the capabilities…
Bitcoin Magazine Hyperscale Data Buys More Bitcoin, Bridging Holdings to Over $72 million Hyperscale Data,…