Bitcoin price extended its decline below the $17,000 level. BTC could avoid a major drop if it closes above the $17,000 resistance zone.
Bitcoin remained in a bearish zone and traded below the $17,000 support.
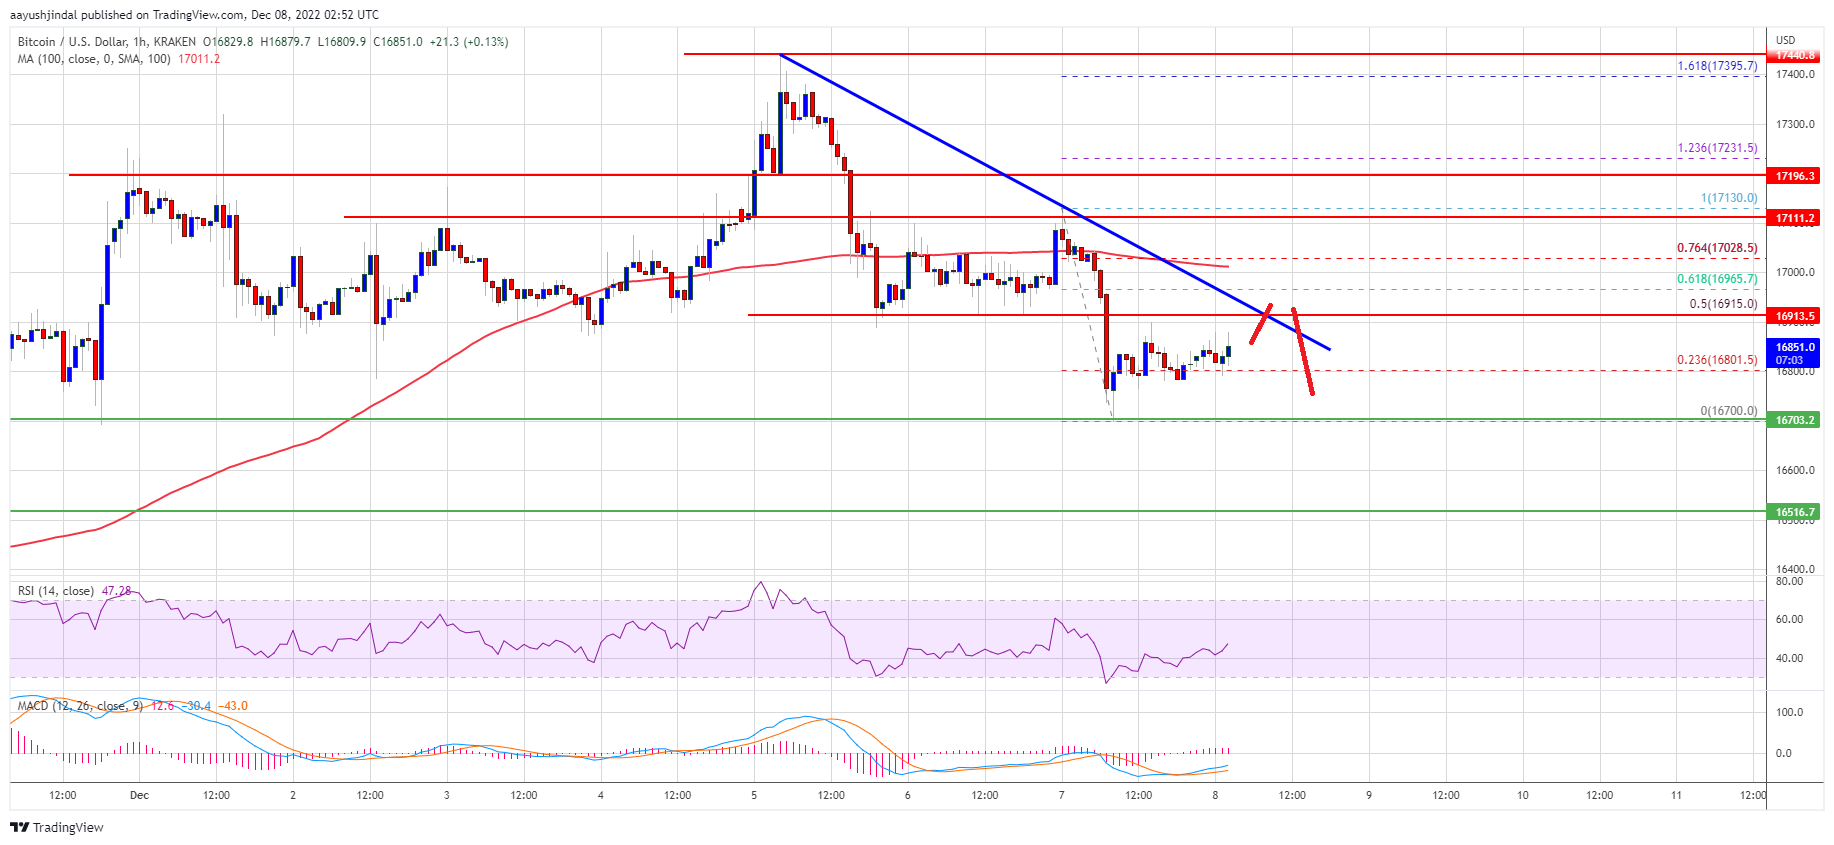
The price is trading below $17,000 and the 100 hourly simple moving average.
There is a key bearish trend line forming with resistance near $16,920 on the hourly chart of the BTC/USD pair (data feed from Kraken).
The pair is showing a few bearish signs below the $17,000 pivot level.
Bitcoin price failed to stay in a positive zone above the $17,000 pivot level. BTC bears were active and there was a push below the $16,800 support zone.
The price tested the $16,700 level and settled below the 100 hourly simple moving average. A low is formed near $16,700 and the price is now consolidating losses. There was a minor increase above the $16,800 resistance level.
Bitcoin price climbed above the 23.6% Fib retracement level of the recent decline from the $17,130 swing high to $16,700 low. It is now trading below $17,000 and the 100 hourly simple moving average. There is also a key bearish trend line forming with resistance near $16,920 on the hourly chart of the BTC/USD pair.
On the upside, an immediate resistance is near the $16,920 level and the bearish trend line. It is near the 50% Fib retracement level of the recent decline from the $17,130 swing high to $16,700 low.
Source: BTCUSD on TradingView.com
The first major resistance is near the $17,000 zone, above which the price may perhaps start another steady increase. In the stated case, the price could rise towards the $17,200 resistance. The next major resistance is near $17,450, above which the price rise towards the $18,000 zone in the near term.
If bitcoin fails to start a fresh increase above the $17,000 resistance, there could be more downsides. An immediate support on the downside is near the $16,700 level.
The next major support is near the $16,500 zone. A downside break below the $16,500 support might call a drop towards $16,000. Any more losses might push the price towards the $15,500 pivot zone in the near term.
Technical indicators:
Hourly MACD – The MACD is now losing pace in the bearish zone.
Hourly RSI (Relative Strength Index) – The RSI for BTC/USD is now near the 50 level.
Major Support Levels – $16,700, followed by $16,500.
Major Resistance Levels – $16,920, $17,000 and $17,200.
Bitcoin price extended its decline below the $17,000 level. BTC could avoid a major drop if it closes above the $17,000 resistance zone.
Bitcoin remained in a bearish zone and traded below the $17,000 support.
The price is trading below $17,000 and the 100 hourly simple moving average.
There is a key bearish trend line forming with resistance near $16,920 on the hourly chart of the BTC/USD pair (data feed from Kraken).
The pair is showing a few bearish signs below the $17,000 pivot level.
Bitcoin price failed to stay in a positive zone above the $17,000 pivot level. BTC bears were active and there was a push below the $16,800 support zone.
The price tested the $16,700 level and settled below the 100 hourly simple moving average. A low is formed near $16,700 and the price is now consolidating losses. There was a minor increase above the $16,800 resistance level.
Bitcoin price climbed above the 23.6% Fib retracement level of the recent decline from the $17,130 swing high to $16,700 low. It is now trading below $17,000 and the 100 hourly simple moving average. There is also a key bearish trend line forming with resistance near $16,920 on the hourly chart of the BTC/USD pair.
On the upside, an immediate resistance is near the $16,920 level and the bearish trend line. It is near the 50% Fib retracement level of the recent decline from the $17,130 swing high to $16,700 low.
Source: BTCUSD on TradingView.com
The first major resistance is near the $17,000 zone, above which the price may perhaps start another steady increase. In the stated case, the price could rise towards the $17,200 resistance. The next major resistance is near $17,450, above which the price rise towards the $18,000 zone in the near term.
If bitcoin fails to start a fresh increase above the $17,000 resistance, there could be more downsides. An immediate support on the downside is near the $16,700 level.
The next major support is near the $16,500 zone. A downside break below the $16,500 support might call a drop towards $16,000. Any more losses might push the price towards the $15,500 pivot zone in the near term.
Technical indicators:
Hourly MACD – The MACD is now losing pace in the bearish zone.
Hourly RSI (Relative Strength Index) – The RSI for BTC/USD is now near the 50 level.
Major Support Levels – $16,700, followed by $16,500.
Major Resistance Levels – $16,920, $17,000 and $17,200.
Tags: bitcoinbitcoin pricebtcusdBTCUSDTxbtusd
NewsBTCRead More
The issuer behind the USDT stablecoin joined a $5.2 million funding round for Ark Labs,…
Bitcoin Magazine Ark Labs Raises $5.2M with Tether to Bring Programmable Finance to Bitcoin A…
Bloomberg Intelligence senior commodity strategist Mike McGlone said bitcoin could still fall back toward and…
BTC holds near $70,000 and outperforms major assets during Middle East tensions, even as derivatives…
Two Prime CEO Alexander Blume says the high yield product driving the buying surge carries…
Your day-ahead look for March 12, 2026Read MoreCoinDesk: Bitcoin, Ethereum, Crypto News and Price Data[#item_full_content]