Bitcoin price is consolidating above the $64,000 level. BTC could try to follow Ethereum and recover if it manages to clear the $65,650 resistance zone.
Bitcoin started a minor recovery wave above the $65,000 level.
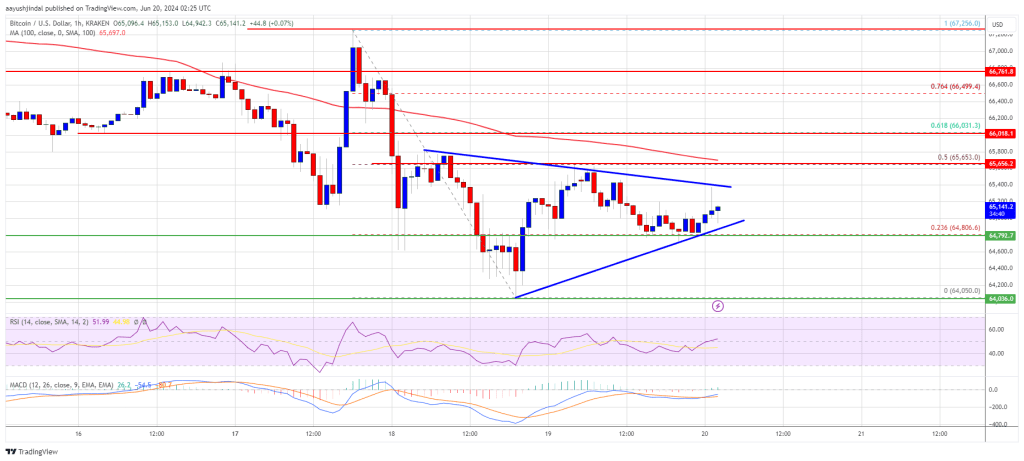
The price is trading below $65,500 and the 100 hourly Simple moving average.
There is a short-term contracting triangle forming with resistance at $65,400 on the hourly chart of the BTC/USD pair (data feed from Kraken).
The pair could start a recovery wave if it clears the $65,400 and $65,650 resistance levels.
Bitcoin price extended its losses and traded below the $65,000 level. BTC even tested the $64,000 zone. A low was formed at $64,050 and the price is now correcting losses.
There was a minor recovery above the $64,500 level. The price climbed above the 23.6% Fib retracement level of the recent drop from the $67,255 swing high to the $64,050 low. However, the bears are still active near the $65,500 zone.
Bitcoin is now trading below $65,500 and the 100 hourly Simple moving average. There is also a short-term contracting triangle forming with resistance at $65,400 on the hourly chart of the BTC/USD pair.
On the upside, the price is facing resistance near the $65,400 level and the triangle trend line. The first major resistance could be $65,650 or the 50% Fib retracement level of the recent drop from the $67,255 swing high to the $64,050 low. The next key resistance could be $66,000.
A clear move above the $66,000 resistance might start a steady increase and send the price higher. In the stated case, the price could rise and test the $66,550 resistance. Any more gains might send BTC toward the $67,500 resistance in the near term.
If Bitcoin fails to climb above the $65,650 resistance zone, it could start another decline. Immediate support on the downside is near the $64,850 level.
The first major support is $64,400. The next support is now forming near $64,000. Any more losses might send the price toward the $63,200 support zone in the near term.
Technical indicators:
Hourly MACD – The MACD is now losing pace in the bearish zone.
Hourly RSI (Relative Strength Index) – The RSI for BTC/USD is now above the 50 level.
Major Support Levels – $64,400, followed by $64,000.
Major Resistance Levels – $65,400, and $65,650.
[#item_full_content]NewsBTCRead MoreStronger dollar, rising Treasury yields, and tech equities treading water contrast with bitcoin’s resilience amid…
Despite trading more than 40% below its all-time high, with $70,000 serving as a short-term…
On-chain analytics firm Santiment has highlighted how the average Bitcoin returns of the buyers from…
Bitcoin has once again acted as a leading indicator for risk assets, plunging sharply before…
Majors posted modest gains Friday with BTC hovering near the top of its month-long range…
Long-term holders now control roughly 14.5 million BTC — coins that have not moved in…