Bitcoin price extended its decline below the $28,000 support. BTC tested $27,650 and is currently attempting a minor upside correction.
Bitcoin is showing bearish signs below the $28,500 resistance zone.
The price is trading below $28,200 and the 100 hourly Simple moving average.
There is a major bearish trend line forming with resistance near $28,000 on the hourly chart of the BTC/USD pair (data feed from Kraken).
The pair could correct higher but upsides might be limited above the $28,500 level.
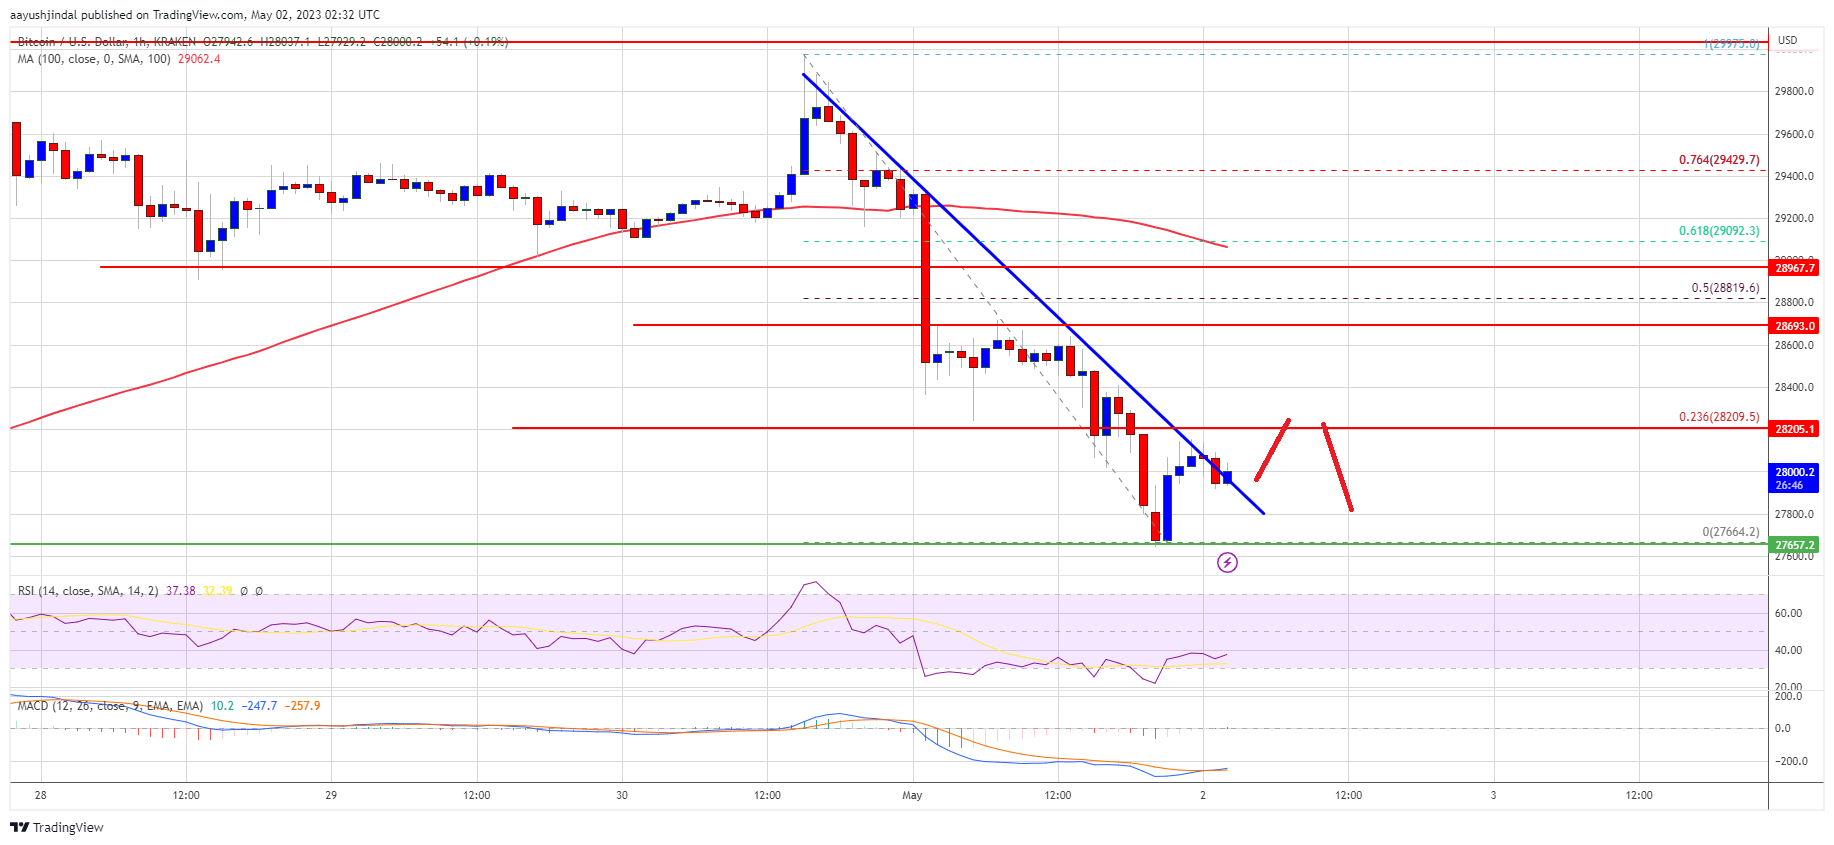
Bitcoin price failed to start a recovery wave above the $29,000 resistance zone. BTC extended its decline and traded below the $28,200 support zone.
The price even broke the $28,000 level and tested $27,650. A low is formed near $27,664 and the price is now consolidating losses. It is trading near the $28,000 resistance zone. There is also a major bearish trend line forming with resistance near $28,000 on the hourly chart of the BTC/USD pair.
Besides, Bitcoin is trading below $28,200 and the 100 hourly Simple moving average. Immediate resistance is near the $28,050 level. The next major resistance sits near the $28,200 zone and the 23.6% Fib retracement level of the downward move from the $29,975 swing high to the $27,664 low.
The first major resistance is near $28,500, above which the price may perhaps test the 50% Fib retracement level of the downward move from the $29,975 swing high to the $27,664 low.
Source: BTCUSD on TradingView.com
The main resistance is near $29,000 and the 100 hourly Simple moving average. A close above the $29,000 resistance could send Bitcoin toward $29,500. Any more gains could open the doors for a test of the key barrier at $30,000.
If Bitcoin’s price fails to clear the $28,200 resistance, it could continue to move down. Immediate support on the downside is near the $27,650 level.
The next major support is near the $27,200 zone, below which the price might dive toward the $26,500 support zone. Any more losses might take Bitcoin toward $25,500 in the near term.
Technical indicators:
Hourly MACD – The MACD is now gaining pace in the bearish zone.
Hourly RSI (Relative Strength Index) – The RSI for BTC/USD is now below the 40 level.
Major Support Levels – $27,650, followed by $27,200.
Major Resistance Levels – $28,200, $28,500, and $28,800.
[#item_full_content]NewsBTCRead MoreInstitutional Bitcoin demand is showing fresh signs of fatigue, with K33 Research reportedly flagging a…
Bitcoin Magazine Trezor Academy Releases Documentary on Africa’s Bitcoin Economy, Opens Education Donations While Western…
Bitcoin Magazine Matt Corallo Urges Bitcoin Projects to Exit GitHub After Rust Lightning Ban GitHub…
The tightening correlation undermines STRC's appeal as a relatively steadier income vehicle.Read MoreCoinDesk: Bitcoin, Ethereum,…
Your bitcoin isn’t just an asset; it’s a future. Ensure your loved ones can access…
Derivatives markets signal that betting on further slide in prices is getting overcrowded, setting up…